
Cryogenic OGS Ltd Secures ₹1.49 Crore Order from Endress and Hauser; Stock Extends Gains – Is this a hidden gem, or just another small-cap riding a headline?

In a fresh sign of operational momentum, Cryogenic OGS Limited (formerly Cryogenic Liquide Private Limited) has announced a significant purchase order from global process automation major Endress and Hauser India. The stock responded positively, climbing over 2% in intraday trade.
The Order Breakdown
In an exchange filing dated May 21, 2026, the company informed the BSE that it has received a purchase order valued at ₹1.49 crore (₹1,49,35,000 excluding GST) for the supply of Metering Skids.
- Customer: Endress and Hauser India (Domestic entity)
- Product: Metering Skids
- Execution Timeline: 10 to 12 Weeks
Market Reaction
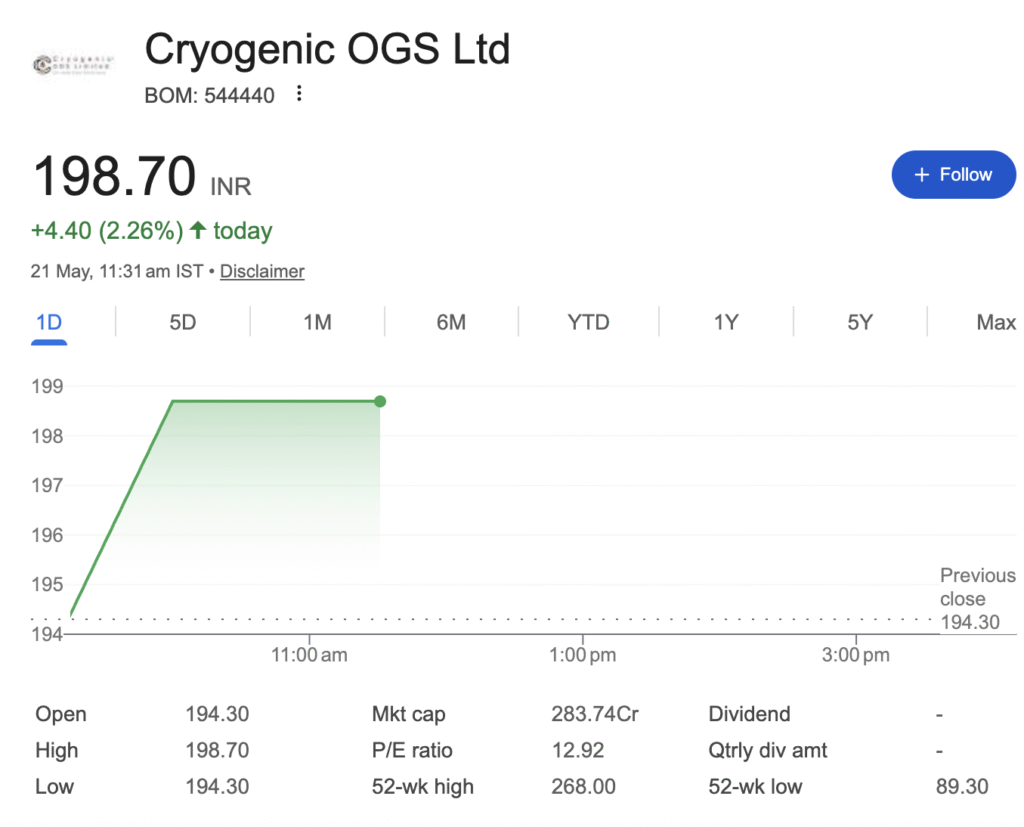
The stock of Cryogenic OGS Ltd was trading at ₹199.85, up ₹4.40 (2.26%) on the BSE at 11:31 AM IST. The intraday chart shows steady buying interest, with the stock hovering near the day’s high. The order, though modest in size compared to large-cap peers, signals the company’s ability to win repeat business from established industrial clients.
Business Overview
Company Background & History
Cryogenic OGS Ltd traces its roots to September 5, 1997, when it was originally incorporated as Mangukia Steel Private Limited. It became Cryogenic Liquide Private Limited on April 27, 2011, before adopting the current name Cryogenic OGS Private Limited on October 20, 2023. The company converted to a public limited entity prior to its SME IPO in July 2025.
Headquartered in Vadodara, Gujarat, the company operates with a lean team of just 31 employees as of the latest reporting period.
Core Business Segments
| Segment | Products / Capabilities | End-Industries |
|---|---|---|
| Metering Skids & Systems | Gas metering skids, meter runs, custody transfer systems | Oil & gas pipelines, LNG terminals |
| Filtration Equipment | Basket strainers, bulk air eliminators, strainer cum air & vapor eliminators | Refineries, petrochemical plants |
| Injection & Dosing Systems | Chemical & additive injection skids, additive dosing blocks | Process industries, fluid handling |
| Specialty Vessels | Pressure vessels, prover tanks, LPG vapor eliminators | Energy storage & transfer |
| Terminal Automation | Master meter trolleys, truck loading skids (liquid & gas) | Terminal operations |
The company delivers end-to-end solutions covering design, process engineering, manufacturing, fabrication, assembly, and testing. It adheres to global standards including ASME, API, and ATEX.
Revenue by Segment & Geography
Segment-wise revenue distribution (based on reported break-up):
| Fiscal Year | Industrial Equipment Revenue (Cr) | % of Total | Other/Unallocated |
|---|---|---|---|
| FY2021 | ₹22.8 Cr | ~100% | – |
| FY2022 | ₹23.3 Cr | ~100% | – |
| FY2023 | ₹22.0 Cr | ~100% | – |
| FY2024 | ₹24.3 Cr | 100% | – |
| FY2025 | ₹32.9 Cr | 100% | – |
Geographical presence:
| Region | FY2024 Revenue (Cr) | FY2025 Revenue (Cr) |
|---|---|---|
| India | ₹23.8 Cr | ₹32.7 Cr |
| Export | ~₹0.4 Cr | ~₹0.2 Cr |
| Other international markets | Nigeria, Singapore, Mauritius, Oman | Expanding footprint |
The company has executed export orders in Nigeria, Singapore, Mauritius, and Oman.
Business Model — Simplified
How Cryogenic OGS makes money:
- Project-based engineering contracts — Wins tenders from oil & gas majors, EPC contractors, and automation companies (Endress & Hauser, Emerson, Honeywell, Suzlon)
- Custom fabrication — Builds metering skids and filtration systems as per client specifications
- Short-cycle execution — Typical order execution timeline: 8–24 weeks. This ensures relatively quick revenue recognition
- Direct sales + tender participation — Primary business acquisition through competitive bids and direct client inquiries
Key Revenue Drivers
- Repeat orders from global clients (Endress & Hauser, Emerson, Suzlon)
- Growing demand for custody transfer metering in LNG and pipeline infrastructure
- National Green Hydrogen Mission creating new metering requirements
Industry & Sector Analysis
The company operates in the Custody Transfer Metering Skids Market — a specialized niche within the broader industrial equipment sector.
| Parameter | Value |
|---|---|
| Global market size (2024) | USD 16,709 million |
| Global market size (2018) | USD 10,480 million |
| Projected market size (2032) | USD 26,205 million |
| CAGR (2024–2032) | 5.67% |
The Global LACT Units Market (a subset of custody transfer metering) reached USD 1.23 billion in 2024, driven by increasing demand for accurate hydrocarbon measurement.
Key Demand Drivers
| Driver | Impact |
|---|---|
| LNG infrastructure expansion | New LNG terminals require high-accuracy custody transfer systems |
| Stricter regulatory standards | Governments mandate certified measurement for trade transparency |
| Cross-border energy trade | Rising international oil & gas trade volume increases metering demand |
| National Green Hydrogen Mission | Hydrogen requires specialized metering solutions — an emerging opportunity |
| Aging infrastructure upgrades | Replacement demand from existing facilities |
| Digitalization & IIoT integration | Smart flow meters and automated monitoring systems driving product upgrades |
Competitive Intensity (Porter’s Five Forces)
| Force | Assessment |
|---|---|
| Rivalry among existing competitors | HIGH — Fragmented market with unorganized local players; competition from INOXCVA, Cryolor, and international firms |
| Threat of new entrants | MODERATE — High technical standards (ASME, API) create entry barriers, but low capital requirement for basic skids attracts small players |
| Threat of substitutes | LOW — Custody transfer requires certified equipment; no viable alternative to metering skids for compliance |
| Bargaining power of buyers | HIGH — Clients like Emerson, Endress & Hauser are large global players with significant negotiating leverage |
| Bargaining power of suppliers | MODERATE — Flow meters and instrumentation sourced from specialized suppliers (some concentration risk) |
Industry Cycle Positioning
The industrial equipment sector is in the mid-to-late growth phase with:
- Increasing automation adoption
- Stable but not explosive growth (5–6% CAGR)
- Consolidation phase where branded, compliant players gain share over unorganized sector
Financial Performance Deep Dive (5 Years)
All figures in ₹ Crores, Fiscal Year ending March 31
| Parameter | FY2022 | FY2023 | FY2024 | FY2025 | FY2026* | 5-Yr CAGR / Trend |
|---|---|---|---|---|---|---|
| Operating Revenue | 23.33 | 22.02 | 24.25 | 32.90 | 40.82 | +11.8% |
| Revenue Growth (YoY) | +2.3% | -5.6% | +10.1% | +35.7% | +29.0% | Accelerating |
| Gross Profit | 8.21 | 9.85 | 10.69 | 13.97 | 21.39 | +21.1% |
| Operating Income | 3.86 | 4.98 | 6.19 | 7.44 | 12.36 | +26.2% |
| Net Income (PAT) | 3.28 | 4.08 | 5.34 | 6.12 | 10.18 | +25.5% |
| Net Income Growth | +14.6% | +24.2% | +31.1% | +14.6% | +66.3% | Explosive in FY26 |
| Operating Profit Margin | 16.5% | 22.6% | 25.5% | 22.6% | 30.3% | Expanding |
| Net Profit Margin | 14.1% | 18.5% | 22.0% | 18.6% | 24.9% | Healthy |
| ROE (%) | ~24% | ~27% | ~28% | ~24% | ~35% | Strong |
| ROCE (%) | ~22% | ~25% | ~27% | ~23% | ~33% | Very strong |
| Debt to Equity | 0.00 | 0.00 | 0.00 | 0.00 | 0.00 | Zero debt |
| Operating Cash Flow | 2.47 | 1.84 | 1.53 | 1.94 | N/A | Stagnant |
| EPS (Basic, ₹) | 3.13 | 3.88 | 5.09 | 5.83 | 7.69 | +20% CAGR |
*FY2026 figures represent trailing twelve months (TTM) estimates based on H1 FY2026 reported data.
Detailed Annual Profit & Loss (₹ Crores)
| Particulars | FY2022 | FY2023 | FY2024 | FY2025 |
|---|---|---|---|---|
| Total Income | 24.00 | 22.71 | 25.67 | 33.79 |
| Total Expenses | 19.57 | 16.37 | 18.55 | 25.52 |
| Operating Profit | 4.35 | 5.65 | 6.38 | 7.96 |
| Operating Profit Margin | 18.65% | 25.66% | 26.31% | 24.19% |
| PBT | 4.43 | 5.48 | 7.12 | 8.27 |
| Tax Paid | 1.15 | 1.40 | 1.74 | 2.18 |
| PAT | 3.28 | 4.08 | 5.38 | 6.09 |
Quality of Earnings — Critical Analysis
✅ Strong Points:
- EPS has grown at ~20% CAGR from ₹3.13 to ₹7.69 (FY2022–FY2026 TTM)
- Margins are among the highest in small-cap industrial equipment segment
- Zero debt ensures no interest burden and high financial flexibility
⚠️ Red Flags (Critical Concerns):
| Issue | Details | Implication |
|---|---|---|
| OCF / PAT divergence | OCF of ₹1.94 Cr in FY2025 vs. PAT of ₹6.12 Cr → ratio of only 32% | Profits being booked but not converted into cash |
| Working capital ballooning | Working capital days jumped from 57 days to 95 days | Cash trapped in inventory & receivables |
| Low OCF despite profit growth | OCF has actually declined from ₹2.47 Cr (FY22) to ₹1.94 Cr (FY25) | Growth is capital-consuming |
| High promoter holding (74%) | Minimal public float → liquidity risk | Price swings can be violent |
Hidden Insight Most Retail Investors Miss:
A company growing PAT at 66% but generating OCF at only 32% of PAT is essentially running a working capital-intensive model. This is NOT sustainable unless the company improves collection cycles or reduces inventory. Retail investors often chase PAT growth without checking cash flow quality.
Balance Sheet & Cash Flow Analysis
Balance Sheet Summary (₹ Crores)
| Particulars | FY2022 | FY2023 | FY2024 | FY2025 |
|---|---|---|---|---|
| Total Assets | 22.43 | 24.00 | 28.35 | 33.85 |
| Fixed Assets (Net Block) | 7.69 | 7.36 | 6.88 | 6.61 |
| Current Assets | 13.56 | 15.26 | 18.91 | 24.22 |
| Shareholder’s Fund (Net Worth) | 13.44 | 17.52 | 22.86 | 28.99 |
| Total Liabilities | 8.99 | 6.48 | 5.49 | 4.86 |
| Book Value per Share (₹) | 12.22 | 15.93 | 20.78 | 26.35 |
Debt Structure
| Parameter | Value |
|---|---|
| Secured Loans | ₹0 |
| Unsecured Loans | ₹0 |
| Debt-to-Equity Ratio | 0.00 |
| Interest Expense (FY2025) | ₹0.06 Cr (minimal) |
The company has zero external debt — an exceptionally strong position for a small-cap manufacturing company.
Working Capital Cycle Analysis
| Parameter | FY2023 | FY2024 | FY2025 | Trend |
|---|---|---|---|---|
| Inventory (₹ Cr) | 1.91 | 3.93 | 5.78 | ⬆ Rapid increase |
| Sundry Debtors (₹ Cr) | 5.14 | 5.34 | 6.62 | ⬆ Growing |
| Current Liabilities (Net) | 6.48 | 5.48 | 4.87 | ⬇ Decreasing |
| Working Capital Days | ~57 days | ~71 days | ~95 days | ⬆ Worsening |
| Cash & Bank Balance | 8.10 | 9.54 | 11.07 | ⬆ Strong |
Interpretation: The company is building inventory (likely for order execution) and receivables are rising. But cash is ALSO growing — meaning the OCF weakness is not due to cash shortage but due to timing differences. This is manageable but needs monitoring.
Cash Flow Statement (₹ Crores)
| Particulars | FY2022 | FY2023 | FY2024 | FY2025 |
|---|---|---|---|---|
| OCF (Operating CF) | 2.47 | 1.84 | 1.53 | 1.94 |
| Capex (Investing CF) | -0.81 | -0.08 | -1.33 | -1.36 |
| Free Cash Flow (FCF) | 1.66 | 1.76 | 0.20 | 0.58 |
| Financing CF | -0.78 | -1.74 | -0.12 | -0.06 |
| Net Cash Flow | 0.88 | 0.02 | 0.08 | 0.52 |
Key Observation: Free cash flow has collapsed from ₹1.76 Cr in FY2023 to just ₹0.58 Cr in FY2025 despite PAT tripling in the same period. This is the single biggest red flag for long-term investors.
Promoter Pledging
| Parameter | Status |
|---|---|
| Promoter Holding (Mar 2026) | 74.29% |
| Pledged Promoter Shares | 0% |
| Promoter Trend | Increased from 73.53% (Sep 2025) to 74.29% (Mar 2026) |
✅ Zero promoter pledging is a MAJOR positive. Promoters have actually increased stake post-IPO, demonstrating confidence.
Institutional Holding — ALARMING TREND
| Category | Sep 2025 | Mar 2026 | Change |
|---|---|---|---|
| FII Holding | 3.34% | 0.00% | ⬇ Complete exit |
| DII Holding | 3.51% | 1.65% | ⬇ Reduced by 53% |
| Mutual Funds | 0.25% | 0.00% | ⬇ Exited |
| Retail & Others | 21.45% | 24.06% | ⬆ Increased |
| Promoters | 73.53% | 74.29% | ⬆ Increased |
🚨 RED ALERT — CRITICAL HIDDEN INSIGHT:
Zero FII holding and DIIs cutting holdings by 53% is a MASSIVE red flag. Institutions — which have dedicated research teams — have collectively exited or reduced positions. The only buying has come from retail investors (up from 21% to 24%) and promoters (up 0.76%). This indicates that smart money is leaving while retail is entering.
Competitive Positioning & Moat
Key Competitors
| Competitor | Market Cap | Key Strength | Overlap with Cryogenic OGS |
|---|---|---|---|
| INOXCVA | ~₹3,500+ Cr | Cryogenic equipment leader | Direct in metering skids |
| Cryolor | Unlisted (global) | International presence | Direct |
| Large EPC players | ₹10,000–1,00,000+ Cr | Scale but less specialized | Indirect (sub-contracting) |
| Unorganized local players | Very small | Low-cost advantage | Direct — price competition |
Market Share: Cryogenic OGS is a niche player with estimated market share of less than 1% of the global custody transfer metering market. India-specific share is slightly higher but still small.
Moat Analysis
| Moat Factor | Cryogenic OGS Strength (1–5) | Explanation |
|---|---|---|
| Pricing Power | ⭐⭐ (2/5) | Low — clients are large global players |
| Entry Barriers | ⭐⭐⭐ (3/5) | ASME/API certification creates barriers |
| Switching Costs | ⭐⭐ (2/5) | Moderate — once installed, replacement costly but not impossible |
| Brand Strength | ⭐⭐ (2/5) | Emerging — orders from Emerson/E&H help |
| Network Effects | ⭐ (1/5) | None — project-based business |
| Scalability | ⭐⭐⭐ (3/5) | Lean model (31 employees) can scale with contract wins |
Verdict on Moat: Cryogenic OGS has a narrow moat based on technical certifications (ASME/API) and client relationships. It does NOT have a wide moat because:
- The industry is fragmented
- Clients are large and powerful
- No proprietary technology patents are evident
Growth Triggers & Future Outlook (2–3 Years)
Order Book Analysis — RECENT DISCLOSURES (Past 12 Months)
| Date | Customer | Order Value | Product |
|---|---|---|---|
| May 21, 2026 | Endress & Hauser India | ₹1.49 Cr | Metering Skids |
| Mar 26, 2026 | Emerson Measurement | ₹5.55 Cr (including GST) | LNG Metering Skid |
| Mar 13, 2026 | Suzlon Western India | ₹1.20 Cr | Root support & tip support |
| Jan 5, 2026 | Emerson Measurement | ₹1.47 Cr | Gas Metering Skid |
| Dec 2025 | Endress & Hauser India | ₹1.51 Cr | Metering Skids |
| Nov 2025 | Suzlon Western India | ₹1.07 Cr | Tower & Nacelle Jig |
| Aug 2025 | Endress & Hauser India | ₹1.61 Cr | Terminal automation systems |
| Jul 2025 | Endress & Hauser India | ₹1.28 Cr | Terminal automation products |
| Honeywell International (USA) | (Earlier) | $231,820 (~₹1.9 Cr) | LNG Metering Skid |
Total Identifiable Orders (Past 12 months): ~₹16–17 Crore
Hidden Insight:
The company has built a repeat-order track record with Endress & Hauser (4 separate orders since August 2025) and Emerson (multiple orders). This indicates client stickiness — a positive sign often missed by retail investors.
Capacity Expansion Plans
| Initiative | Details |
|---|---|
| Wholly-owned subsidiary | Approved in Jan 2026 — likely for geographic expansion or vertical integration |
| IPO proceeds utilization | ₹17.77 Cr raised primarily for working capital — not large capex |
Valuation Analysis
Current Valuation Multiples
| Metric | Cryogenic OGS | Industry Peer Average |
|---|---|---|
| P/E (TTM) | 28.31x | 22–25x |
| P/B Ratio | 5.27x | 3.5–4.5x |
| EV/EBITDA | ~20x (estimated) | 14–16x |
| ROE | 23.61% | 15–18% |
| ROCE | ~22% | 16–18% |
Source: Bajaj Finserv, Torus Digital
Peer Comparison (Small-cap Industrial Equipment)
| Company | P/E (TTM) | P/B | Market Cap (Cr) |
|---|---|---|---|
| Cryogenic OGS | 28.31 | 5.27 | ~₹288 |
| Batliboi Ltd | 32.93 | 1.70 | ₹384 |
| KPT Industries | ~13 | — | ₹163 |
| Shakti Pumps | ~25 | — | Larger cap |
Historical Valuation Journey
| Event | Price (₹) | P/E (approx) |
|---|---|---|
| IPO Issue Price | 47 | ~9x |
| Listing Price (Jul 10, 2025) | 89.30 | ~17x |
| 52-week high (recent) | 268 | ~46x |
| Current (May 21, 2026) | 199.85 | ~28x |
Is the Stock Cheap, Fairly Valued, or Expensive?
| Valuation Basis | Conclusion |
|---|---|
| Absolute basis (P/E 28x) | Expensive for SME with working capital issues |
| Relative to industry | Expensive (28x vs sector 22–25x) |
| Relative to historical | Fair after correction from 46x peak |
| Given zero debt | Premium justified to SOME extent |
| Given OCF issues | Current valuation NOT justified |
Valuation Justification in Simple Words:
Cryogenic OGS is trading at a P/E of 28x — meaning you’re paying ₹28 for every ₹1 of annual profit. For a company where profits are not converting to cash (OCF/PAT ratio 32%), this premium is hard to justify. The zero debt is a positive, but working capital inefficiency erodes that advantage. For the stock to be fairly valued, either earnings must grow 30%+ annually for 3 years, OR the price must correct 20–25%.
Fair Value Estimate: ₹145–165 (based on 22–25x P/E on FY25 EPS of ₹5.83) — implies 15–25% downside from current levels.
⚠️ Risk Factors (Very Important)
Business Risks
| Risk | Description | Severity |
|---|---|---|
| Customer concentration | Repeat orders from E&H, Emerson — loss of any one would impact | HIGH |
| Project-based revenue | No recurring revenue model; each order must be won anew | HIGH |
| Small employee base (31) | Key person risk; ability to execute multiple large orders simultaneously? | MODERATE |
| Working capital stress | Days worsening from 57 to 95 → cash conversion cycle strain | HIGH |
Financial Risks
| Risk | Description | Severity |
|---|---|---|
| FCF collapse | FCF dropped from ₹1.76 Cr to ₹0.58 Cr despite PAT growth | HIGH |
| OCF/PAT divergence | Only 32% of profits turning into cash | HIGH |
| Low public float | Only 26% shares in public hands → volatile price swings | MODERATE |
Investment Thesis
Bull Case (Why It Can Outperform)
- Zero debt balance sheet — Interest-free growth, high financial flexibility
- Marquee client list — Endress & Hauser, Emerson, Suzlon, Honeywell — each order is a quality stamp
- High margins — Operating margin of 30%+ is exceptional for industrial equipment
- Industry tailwinds — LNG, green hydrogen, pipeline expansion all drive metering demand
- Promoter confidence — Stake increased post-IPO; zero pledging
- Repeat orders — 4 orders from E&H in 10 months indicates client stickiness
Bear Case (What Can Go Wrong)
- ❌ Complete exit by FIIs and DIIs — Smart money leaving while retail enters
- ❌ FCF has collapsed — Profits not translating to cash → eventual dividend/growth constraint
- ❌ Working capital deterioration — Days up from 57 to 95 → efficient?
- ❌ Valuation premium — P/E 28x vs industry 22–25x with no premium justification
- ❌ Concentrated promoter holding (74%) — Low float means volatile price action
- ❌ No recurring revenue — Must win every order; no predictable base
Key Monitorables for Investors
| Monitor | What to Watch | Frequency |
|---|---|---|
| Quarterly OCF | Does OCF improve relative to PAT? | Quarterly |
| Working capital days | Does it stabilize below 80 days? | Quarterly |
| FII/DII holding | Any re-entry by institutions? | Quarterly |
| Order book disclosure | Regularity and size of new order announcements | Ongoing |
| Margins | Can 30%+ OpM be sustained? | Quarterly |
| Capacity expansion | Any news on new facility? | 6–12 months |
| Subsidiary incorporation | Purpose and scale of new subsidiary | As disclosed |
Clear Conclusion
Cryogenic OGS Ltd is a classic “show-me” story.
The company has many strengths: zero debt, marquee clients, high margins, promoter confidence, and industry tailwinds. However, it has two non-negotiable problems that cannot be ignored:
- Institutions have left in droves — FIIs went from 3.34% to ZERO. DIIs cut holdings by 53%. Institutions have dedicated research teams. Their exit is a signal.
- Profits are not turning into cash — FCF collapsed from ₹1.76 Cr to ₹0.58 Cr while PAT tripled. This is not a sustainable model.
Analyst Verdict:
The stock is currently overvalued at P/E 28x given its FCF generation issues and institutional exit. Wait for a price correction of at least 20–25% (towards ₹140–150) before considering any position. Even then, allocation should be very small and only for aggressive investors with a 5+ year horizon.
The single biggest question every investor must ask before buying:
“If institutions with full-time research teams have collectively exited this stock, what do they know that I don’t?”
Disclaimer: “BrightStake” is only an Educational Platform and is not registered under any SEBI Regulations. All Information on this page is for Educational and Entertainment purposes only. Our content does not constitute any Trading or Investment advice. We make no representation of the Timeliness, Accuracy, Profitability, or Suitability of any share on this Website, and we cannot be held liable for any Irregularity or Inaccuracy. Investors are advised to conduct their own independent research and consult with a qualified financial advisor before making any investment decisions.