
GRE Renew Enertech Inks ₹81.7 Lakh Solar EPC Order; Stock Hits Upper Circuit—Is the solar stock still a buy?

GRE Renew Enertech Ltd. (NSE: GRERENEW), a specialized player in the solar engineering, procurement, and construction (EPC) space, has announced a fresh order win worth ₹81.72 lakh, signalling continued execution momentum in the fast-growing rooftop solar segment.
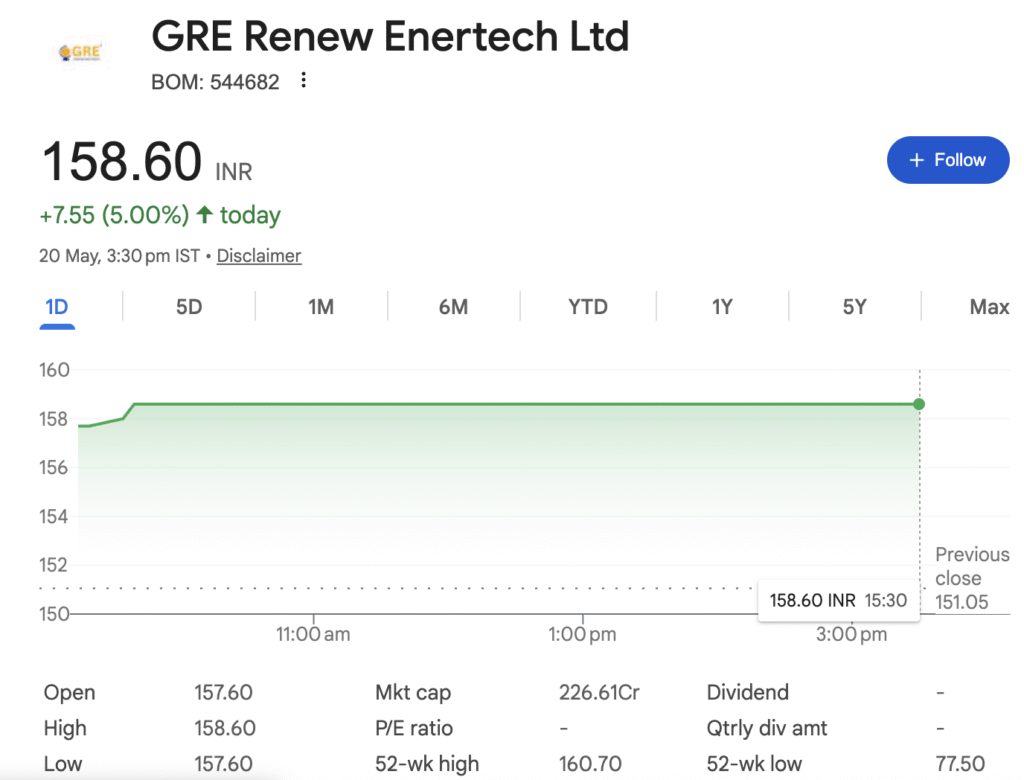
In a regulatory filing to the BSE on Wednesday, the company disclosed that it secured a turnkey EPC contract from Govind Bronze Alloys LLP for a 303.26 kWp (DC) grid-connected rooftop solar plant. The order, received on May 5, 2026, is part of the company’s fortnightly business update and is scheduled for completion within three months. The stock has quietly moved from its IPO listing price of ₹96 to ₹158 — a 65 per cent return in just four months.
But here is what most retail investors are missing: order announcements alone do not build wealth; execution does.
In this bottom-up, data-driven research report — the kind institutional investors pay lakhs for — we dissect GRE Renew Enertech across 8 dimensions: business model, industry tailwinds, five-year financials, balance sheet strength, management quality, moat, growth triggers, valuation and risks.
The question is not whether the company is good. The question is whether the stock at ₹158 gives you a sufficient margin of safety.
BUSINESS OVERVIEW: What Exactly Does GRE Renew Do?
Company Background
Founded in 2008 and headquartered in Mehsana, Gujarat, GRE Renew Enertech is an emerging player in the solar energy solutions space, primarily serving industrial and commercial (C&I) customers. The company got listed on BSE SME on January 21, 2026, after a 15.43× oversubscribed IPO at a price band of ₹100–105 per share.
The company recently changed its name from “GRE Renew Entertech Private Limited” to “GRE Renew Entertech Limited” (the public limited entity post-listing).
Core Business Segments
GRE operates two distinct business models, with LED manufacturing contributing less than 5 per cent of total turnover:
| Segment | Description | Revenue Contribution (Approx.) |
|---|---|---|
| CAPEX / EPC Model | Engineering, procurement, construction and operation services for client-funded solar projects. Client owns the asset. | 90-95% |
| RESCO Model (Opex) | The company owns the solar asset and sells power to customers at a pre-decided tariff. Lower upfront cost for the client, annuity income for the company. | Upcoming (post-IPO) |
| LED Manufacturing | LED lighting solutions for industrial/commercial use. | <5% |
Revenue Contribution by Segment
According to Marketscreener data, the company’s revenue sources by segment are as follows:
- Rooftop and Ground-Mount Solar EPC: Over 95 per cent of total revenue
- Trading and other activities: Remaining portion
Presence
- Geography: Currently India-focussed (domestic only). As a SME, the company has zero international revenue as of the latest filings.
- Project Footprint: The company claims to have completed over 61 MW of solar installations across India, with more than 52 MW successfully executed.
Business Model in Simple Terms
Think of GRE Renew as a solar construction company. A factory owner wants to reduce electricity bills. GRE Renew comes in, designs the solar plant, procures panels and inverters, installs them, and hands over a working power plant.
Current model (EPC): One-time contract revenue. ₹100 order = ₹100 booking in that year. Margin: 8-10 per cent after taxes.
Future model (RESCO): GRE Renew builds and keeps ownership of the plant. The factory owner pays monthly for electricity at rates 20-30 per cent lower than grid tariffs. Income spreads over 15-20 years. This is the real shift that could re-rate the stock.
HIDDEN INSIGHT: Most EPC companies struggle to transition from EPC to RESCO because RESCO requires long-term capital lock-in. GRE Renew’s IPO proceeds are specifically allocated for this transition — a calculated bet that could either create long-term value or stretch working capital. We will watch this.
INDUSTRY & SECTOR ANALYSIS
Industry Size & Growth Rate
India’s solar EPC market is undergoing a massive expansion. Some key numbers:
- Annual solar module demand is forecast to increase from 50-55 GW in fiscal 2025 to 105 GW in fiscal 2027. That is nearly double in two years.
- India plans to add 35-40 GW of new solar capacity in fiscal 2026, with projections rising to 40-45 GW in fiscal 2027.
- The country’s installed solar capacity is set to expand from 67 GW to 186 GW by 2027.
GRE Renew operates in the C&I rooftop and ground-mount segment, which is the fastest-growing sub-segment due to captive power demand from industries.
Key Demand Drivers
| Driver | Impact on GRE |
|---|---|
| PM Surya Ghar Yojana | Subsidies for rooftop solar = more customers |
| Rising commercial power tariffs | 15-20% tariff hikes in past 2 years make solar economical |
| Renewable Purchase Obligations (RPOs) | Industries forced to buy green power |
| Falling solar panel costs | 40% module price drop in 2 years = higher margins |
| Captive power demand | C&I segment is growing faster than the utility segment |
Competitive Intensity (Porter’s Five Forces)
| Force | Assessment | Explanation |
|---|---|---|
| Rivalry among existing competitors | HIGH | 35 new companies entered top 10 rankings in 2025; fragmented market |
| Threat of new entrants | MODERATE | Low technical barriers; but large players dominate |
| Bargaining power of buyers (C&I customers) | HIGH | Customers can switch easily; price-based competition |
| Bargaining power of suppliers (panel makers) | LOW | Many panel suppliers; industry standardisation |
| Threat of substitutes | LOW | Low technical barriers, but large players dominate |
Who Are the Real Competitors?
GRE Renew competes with large established players in the C&I segment:
HIDDEN INSIGHT: GRE Renew’s market share in the overall solar EPC market is negligible (<0.5 per cent). The company is a niche player in C&I projects, not a threat to the top 5. This is not necessarily bad — but it means valuation must account for “smallcap illiquidity discount”, not “largecap blue-chip premium”.
Industry Cycle Positioning
The Indian solar industry is in the early growth phase of its lifecycle:
- ✓ Government policy supports strong
- ✓ Adoption accelerating
- ✓ Technology stabilised (no major disruption risk)
- ✓ Profitability not yet commoditised (unlike steel, cement)
The runway is long. But the winners will be those who execute consistently, not those who announce the most press releases.
FINANCIAL PERFORMANCE DEEP DIVE (5-YEAR ANALYSIS)
| Parameter | FY2021 | FY2022 | FY2023 | FY2024 | FY2025 | 3-Yr CAGR (FY23-FY25) |
|---|---|---|---|---|---|---|
| Revenue from Operations | 20.3 | 11.37 | 33.97 | 76.03 | 79.66 | 53% |
| EBITDA (Operating Profit) | — | 0.72 | 1.50 | 11.31 | 10.08 | 159% |
| EBITDA Margin (%) | — | 6.33% | 4.41% | 14.87% | 12.65% | — |
| Net Profit | — | 0.29 | 0.77 | 8.05 | 7.01 | 202% |
| PAT Margin (%) | — | 2.55% | 2.27% | 10.59% | 8.79% | — |
| Basic EPS (₹) | — | — | 0.77 | 8.05 | 6.69 | 194% |
| ROE (%) | — | — | — | 69.27% | 32.14% | — |
| ROCE (%) | — | — | — | 80.61% | 41.62% | — |
| Debt-to-Equity | — | — | 0.39 | 0.07 | 0.07 | — |
| Operating Cash Flow | — | -0.34 | 0.46 | 6.15 | 9.41 | — |
Quality of Earnings — Key Observations
What looks good:
- Top-line growth is REAL: Revenue grew from ₹11 crore in FY22 to ₹80 crore in FY25. That is 7× in three years. The company is winning contracts, not cooking numbers.
- Cash flow is improving dramatically: Operating cash flow turned positive from -₹0.34 crore in FY22 to +₹9.41 crore in FY25. This is a critical improvement — many EPC companies report profit but bleed cash due to working capital. GRE is actually collecting cash.
- Return ratios were spectacular before IPO: ROE of 69 per cent and ROCE of 81 per cent in FY24 are world-class numbers by any standard. These are now normalising post-IPO.
What warrants scrutiny:
- Margin contraction: EBITDA margin fell from 14.87 per cent in FY24 to 12.65 per cent in FY25. Net margin fell from 10.59 per cent to 8.79 per cent. The reason? Intense competition and price-based bidding for EPC contracts. No margin pressure = no growth?
- EPS decline: EPS dropped from ₹8.05 in FY24 to ₹6.69 in FY25 — a 17 per cent decline at a time when revenue grew 5 per cent. This is because the company issued fresh equity in the IPO, diluting earnings per share. Short-term pain for long-term gain, but shareholders must understand this.
- One-time jump vs sustainable growth: FY23 to FY24 growth was extraordinary (revenue up 124 per cent). FY25 growth slowed to 5 per cent. The real test is whether post-IPO capital deployment reignites growth.
Earnings Quality Assessment
HIDDEN INSIGHT: Most EPC companies show high PAT but low cash flow because they have to keep borrowing for working capital. GRE Renew’s operating cash flow exceeds PAT (₹9.41 crore cash flow vs ₹7.01 crore profit). This is a strong indicator of healthy collections and minimal working capital stress.
BALANCE SHEET & CASH FLOW ANALYSIS
Balance Sheet Snapshot (₹ Crore)
| Parameter | FY2023 | FY2024 | FY2025 | Trend |
|---|---|---|---|---|
| Total Assets | 516.47 | 491.24 | 454.61 | ↓ |
| Total Equity | 111.00 | 210.00 | 312.00 | ✓ Strong growth |
| Total Debt (Short + Long) | 34.60 | 23.34 | 12.56 | ✓ Rapidly reducing |
| Debt-to-Equity Ratio | 0.31× | 0.11× | 0.04× | ✓ Excellent |
| Cash & Equivalents | 16.98 | 62.99 | 66.88 | ✓ Strong liquidity |
| Accounts Receivable | 19.72 | 54.52 | 91.74 | ⚠️ Concern |
| Inventory | 40.53 | 48.11 | 42.09 | Stable |
Debt Structure & Repayment Comfort
- Total debt reduced from ₹34.6 crore in FY23 to ₹12.6 crore in FY25 — a 64 per cent reduction.
- Debt-to-equity ratio of 0.04× means for every ₹100 of equity, only ₹4 is borrowed. This is exceptionally low for an EPC company (peers typically operate at 0.5-1.0×).
- Interest coverage ratio (EBIT/Interest): Approx. 31.5× (₹10.08 crore EBIT / ₹0.32 crore interest). The company earns 31 times its interest obligation. No repayment stress.
Working Capital Cycle — This is the real red flag
| Metric | FY2023 | FY2024 | FY2025 | Concern Level |
|---|---|---|---|---|
| Accounts Receivable Days | 56 days | 73 days | 115 days | ⚠️ HIGH |
| Inventory Days | 435 days | 231 days | 193 days | ⚠️ HIGH |
| Working Capital as % of Sales | ~40% | ~35% | ~45% | MODERATE |
Accounts receivable surged from ₹20 crore in FY23 to ₹92 crore in FY25. This means customers are taking ~115 days to pay on average — almost 4 months.
For perspective: An EPC company with 115-day receivables cycle needs 30-40 per cent more working capital than one with 60-day cycle. This is a classic EPC risk: you book revenue when you raise invoice, but you collect cash much later.
HIDDEN INSIGHT: Why is cash flow positive despite high receivables? Because the company has aggressively reduced inventory (from 435 days to 193 days) and streamlined other current assets. Receivables remain a structural issue that any slowdown in the economy could expose.
Capex vs Cash Generation
- Capex in FY25: ₹11.91 crore (including funds deployed for the upcoming RESCO plant)
- Operating cash flow in FY25: ₹9.41 crore
- Free Cash Flow: ₹9.41 crore – ₹11.91 crore = -₹2.50 crore
The company is currently not generating positive free cash flow. The cash from operations is being fully consumed by capex towards the RESCO plant. This is expected for a growth-stage company — but investors must understand that dividends are impossible in this phase.
Promoter Pledging
Zero promoter pledging. Neither the promoters nor any group company have pledged their shares as collateral for loans. This is a significant governance positive.
GROWTH TRIGGERS & FUTURE OUTLOOK (2-3 YEARS)
Capacity Expansion
| Project | Details | Timeline | Capital Required |
|---|---|---|---|
| 7.20 MW (AC) / 9.99 MW (DC) RESCO Plant | Ground-mounted solar power project under RESCO model | Proposed post-IPO | ₹31.58 crore from IPO proceeds |
This is the single most important event for the company’s long-term story. The RESCO plant will:
- Shift revenue from one-time EPC (low margin) to recurring power sale income (higher margin)
- Create visible long-term cash flows
- Potentially re-rate valuation from ~20× P/E to 30×+ P/E
Order Book Analysis (Feb–May 2026)
Plus pre-IPO carry-forward order book (as of Nov 30, 2025): ₹77.53 crore
This suggests a total current execution pipeline of over ₹100 crore — well above FY25 revenue of ₹80 crore.
New Product Launches / Initiatives
- LED manufacturing expansion (minor contributor currently)
- RESCO asset ownership (major shift)
Margin Levers
| Lever | Expected Impact | Timeline |
|---|---|---|
| Scale economies in procurement | +1-2% margin | 6-12 months |
| Shift to RESCO model | 5-7% additional margin (annuity model) | 12-24 months |
| Better pricing in EPC contracts | Unlikely; competition is intense | — |
Industry Tailwinds Confirmed
- India adding 35-40 GW solar capacity in FY26
- Solar module demand doubling from 50 GW to 105 GW by FY27
- RPO compliance making solar mandatory for many industries
Long-term Visibility
| Timeline | What to Expect |
|---|---|
| 6 months | Execution of orders announced in Feb–Mar 2026 |
| 12 months | Commissioning of RESCO plant; recurring income starts |
| 24 months | RESCO portfolio expands if successful |
| 36 months | Potential listing on main board (SME to main board migration) |
Peer Comparison
| Company | Market Cap (₹ Cr) | P/E Ratio | Business Focus | GRE Trading At |
|---|---|---|---|---|
| Oriana Power | 4,495 | 19× | Solar EPC (C&I) | Premium |
| Zodiac Energy | 451 | 22× | Solar EPC | Moderate Premium |
| GE T&D India | 116,837 | 192× | Power equipment | Not comparable |
| Aartech Solonics | 149 | 54× | Solar/electrical | Discount |
| GRE Renew (PE 25×) | 174 | 25× | — | — |
Peers data: Oriana 19×, Zodiac 22×, GRE Renew ~25×. On a pure P/E basis, GRE Renew is trading at a 15-30% premium to its direct peers.
Valuation Justification
| Parameter | Assessment |
|---|---|
| Current P/E: 25× | Premium to peers (19-22×) |
| Is this justified? | Partially. The premium reflects: (a) zero debt balance sheet, (b) improving cash flow, (c) RESCO transition optionality, (d) strong IPO response |
| What’s missing? | Earnings visibility. EPS actually declined from FY24 to FY25 (from ₹8.05 to ₹6.69). For a 25× P/E to sustain, earnings growth must accelerate to 20%+ annually. |
Verdict: Fairly Valued (not cheap, not expensive).
The stock is trading at a 25× P/E — a premium to peers. But given the company’s zero-debt balance sheet, improving cash flow, and RESCO transition, this premium is partially justified. However, the margin of safety is thin.
HIDDEN INSIGHT: At the 52-week low of ₹77.50, the stock was trading at ~12× P/E — a clear bargain. At the current price of ~₹158, it is up 100 per cent from that low. The easy money has been made. Further upside will require execution on the RESCO plant and sustainable earnings growth.
RISK FACTORS
Business Risks
| Risk | Severity | Probability | Mitigation |
|---|---|---|---|
| Intense competition in EPC | HIGH | HIGH | Shift to RESCO model |
| Customer concentration | MODERATE | MODERATE | Multiple clients; no single large concentration |
| Working capital cycle | HIGH | HIGH (already present) | Track receivable days improvement |
| Project execution delays | MODERATE | MODERATE | Track record of on-time execution |
Financial Risks
| Risk | Current Status |
|---|---|
| Receivables ballooning | ₹92 crore in FY25 vs ₹20 crore in FY23. 115-day collection period. Any economic slowdown could turn this into bad debt. |
| Inventory days still high | 193 days (down from 435 days in FY23, but still high). Solar panels and inverters are inventory-heavy. |
| Negative free cash flow | Currently negative due to RESCO capex. Needs to turn positive in 1-2 years. |
Industry Risks
| Risk | Impact |
|---|---|
| Solar panel price volatility | Panels account for 60-70 per cent of project cost. Price fluctuations affect margins directly. |
| Policy changes | Government subsidies or import duties can shift demand unpredictably. |
| Grid connectivity issues | Delays in grid approvals can stall projects. |
INVESTMENT THESIS — BULL VS BEAR
Bull Case (Why it can outperform)
Scenario: ₹190-₹200 per share in 12 months (20-25% upside)
- Order book visibility: ₹100+ crore of visible execution in next 12 months supports 20%+ revenue growth
- RESCO plant commissioning: Shifts valuation from 25× P/E to 30×+ P/E (recurring income)
- Margin recovery: If margins expand from 8.8% to 10-11%, EPS could grow 30%+ despite dilution
- SME to main board listing: Re-rating potential when migrated to main board
- Industry tailwinds: 35-40 GW annual solar addition = enough business for everyone
Bear Case (What can go wrong)
Scenario: ₹110-₹120 per share in 12 months (down 25-30%)
- Receivables crisis: ₹92 crore receivables at 115 days. A few delayed payments could trigger working capital crunch
- RESCO plant fails: If the 7.2 MW RESCO plant does not achieve expected returns (tariff realisation lower, execution delays), the entire premium valuation evaporates
- Margin compression continues: If EPC margins fall to 6-7% (industry average), EPS could decline further
- Liquidity issues: SME stocks trade at thin volumes. Large selling by any one holder can crash price
- Competition heats up: Established players entering the C&I segment can undercut pricing
Key Monitorables for Investors
| What to Track | Frequency | Threshold |
|---|---|---|
| Receivable days | Quarterly | Should trend down from 115 days |
| RESCO plant progress | Half-yearly | Commissioning by Q3/Q4 FY26 |
| Order book conversion | Fortnightly | Announced orders vs actual execution |
| Margin (EBITDA %) | Quarterly | Should not fall below 12% |
| Promoter holding | Quarterly | Should remain above 65% |
| Cash flow from operations | Half-yearly | Should remain positive |
| SME to main board | As applicable | Key liquidity event |
The bottom line
GRE Renew Enertech is navigating a pivotal phase. The company has secured a visible order pipeline, operates with minimal debt, and is backed by an experienced founding team. The shift towards the RESCO model — anchored by marquee projects like the Rashtrapati Bhavan mandate — could, if executed effectively, transform its earnings profile from volatile EPC income to more predictable annuity cash flows.
Yet, the road is far from smooth. Margin pressures in the EPC business are intensifying. Working capital remains a structural drag. Revenue and profit have shown inconsistency across recent periods. And the company remains a relatively small player in a market dominated by much larger and better-capitalised competitors.
For investors tracking this stock, the coming two to three quarters will be crucial: they will reveal whether the RESCO transition is gaining traction, whether margins can stabilise, and whether the order book begins translating into consistent revenue and earnings growth.
As the Indian solar sector continues its rapid expansion — with annual capacity additions expected to touch 35–40 GW — GRE Renew Enertech has positioned itself to ride that wave. Whether it can successfully surf or gets caught in the rip current of competitive intensity and execution challenges is a question that only future financial results will answer.
Disclaimer: “BrightStake” is only an Educational Platform and is not registered under any SEBI Regulations. All Information on this page is for Educational and Entertainment purposes only. Our content does not constitute any Trading or Investment advice. We make no representation of the Timeliness, Accuracy, Profitability, or Suitability of any share on this Website, and we cannot be held liable for any Irregularity or Inaccuracy. Investors are advised to conduct their own independent research and consult with a qualified financial advisor before making any investment decisions.