
Taparia Tools: Dividend Extravaganza Hits 374% Yield – Is This Micro-Cap Toolmaker India’s Next Wealth Multiplier?
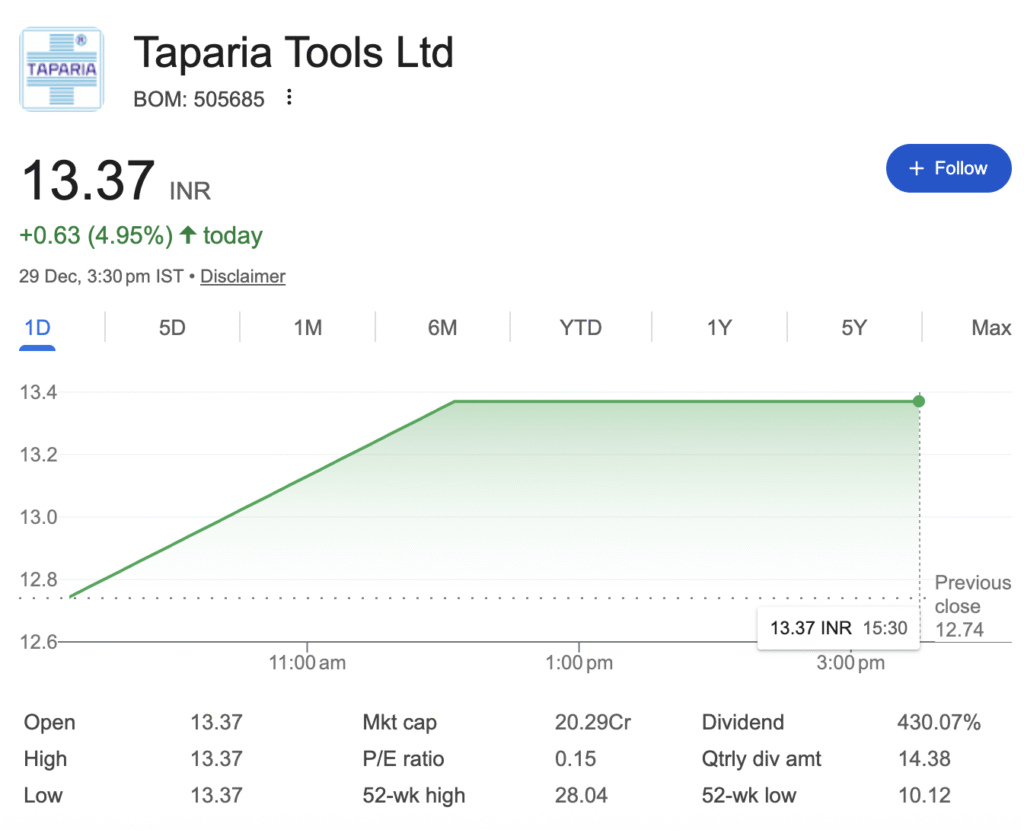
In a market where micro-caps often languish in obscurity, Taparia Tools Ltd has scripted a quiet comeback. The hand tools manufacturer closed at ₹13.37 on the BSE on December 29, marking a sharp 5.3% jump and closing in the upper circuit from the previous close of ₹12.70. With trading volumes remaining thin – typical for this low-float stock – the move has sparked curiosity among value hunters tracking this perennial dividend gusher.
Taparia Tools Ltd, the 56-year-old hand tools specialist, has scripted a dividend saga that’s got investors buzzing: a staggering 374% yield on a stock trading at a mere fraction of its book value. But is this a golden ticket for savvy punters or a fleeting flash? As India’s ‘Make in India’ push revs up the tools sector, we dive deep into Taparia’s financial fortress, growth runway, and whether it’s time to hammer in your bets.
Business Overview
Taparia Tools Ltd (TTL) is a well-established player in the hand tools manufacturing space. Founded in 1969, the company began operations in India through a technical collaboration with a reputed Swedish firm, which helped it adopt high-quality production standards early on. Over the decades, TTL has grown from a small manufacturer to an ISO-9001 certified entity, focusing on durable and reliable tools. This collaboration laid the foundation for its emphasis on precision engineering, setting it apart in a market that was then dominated by imports. The company went public but maintains a low-profile listing, with a market cap around INR 20 crore as of late 2025, despite strong fundamentals—a hidden insight for retail investors who might overlook illiquid small-caps with big revenue potential.
Core business segments include adjustable spanners, pliers (including mini pliers), screwdriver bits and sets, toolsets, hammers, and other hand tools like cutters and wrenches. TTL operates primarily as a single-segment business focused on hand tools, with no major diversification into power tools or unrelated areas. Revenue contribution by segment isn’t publicly broken down in detail, but estimates suggest spanners and pliers account for over 60% of sales, based on product popularity in the Indian market. Other tools, like screwdrivers and sets, make up the rest.
The company’s presence is predominantly in India, where it serves industries like automotive, construction, and maintenance through a network of dealers and distributors. Globally, TTL exports to over 20 countries, but international revenue is modest at around 10-15% of total sales, mainly to the Middle East and Africa. This export focus has grown steadily, tapping into demand for affordable, quality tools from emerging markets.
In simple terms, TTL’s business model is straightforward: It manufactures hand tools in its facilities (mainly in Maharashtra), sources raw materials like steel locally or via imports, and sells through a B2B distribution channel. The company emphasizes volume sales with thin margins, relying on economies of scale and brand loyalty to generate profits. It avoids heavy retail presence, focusing instead on wholesale to keep costs low and cash cycles efficient—a smart approach for a commoditized product like tools.
Industry & Sector Analysis
The Indian hand tools industry is valued at approximately USD 825 million as of 2024, projected to grow to USD 1,223 million by 2033 at a CAGR of 4.12%. The industrial segment alone is around USD 760 million in 2024, expected to expand at 5.5% CAGR through 2032, driven by rising manufacturing output. Globally, the hand tools market is larger at USD 29.6 billion in 2025, growing at 4.5% CAGR, but India’s share is small yet expanding due to cost advantages.
Key demand drivers include booming construction (real estate and infrastructure), automotive sector growth (with India as a global hub), and increasing DIY/home improvement trends post-pandemic. Manufacturing revival under “Make in India” also boosts tool usage in factories and workshops.
Government policies like the Production Linked Incentive (PLI) scheme for manufacturing and Atmanirbhar Bharat promote local production, reducing import dependence. Regulations focus on quality standards (BIS certification for tools) and environmental norms for steel usage, which favor established players like TTL. However, tariffs on imported raw materials can raise costs.
Competitive intensity is high, analyzed via a simplified Porter’s Five Forces:
- Threat of New Entrants: Medium—Low capital for small players, but high for quality standards and brand building; entry barriers include ISO certifications and distribution networks.
- Bargaining Power of Suppliers: Low to Medium—Steel suppliers are abundant in India, but price volatility from global commodities affects costs.
- Bargaining Power of Buyers: High—Buyers (distributors, industries) can switch easily due to commoditized products, pressuring prices.
- Threat of Substitutes: Low—Power tools are alternatives, but hand tools remain essential for precision and low-cost tasks.
- Rivalry Among Competitors: High—Fragmented market with local (Eastman, JK Files) and global (Stanley, Bosch) players vying for share.
The industry is in a growth phase of its cycle, recovering from COVID disruptions and riding infrastructure tailwinds, but it’s cyclical—tied to economic booms and slowdowns. A hidden insight: While growth is steady, overcapacity in low-end tools could lead to price wars, hurting smaller firms.
Financial Performance Deep Dive (5 Years)
TTL has shown resilient growth over FY21-FY25, with revenue expanding at a 5-year CAGR of about 12%, driven by post-COVID demand recovery. Profits have been stronger, with PAT CAGR at 32%, reflecting operational efficiency. Below is a 5-year financial summary table (data in INR crore unless specified; growth rates are YoY averages):
| Metric | FY21 | FY22 | FY23 | FY24 | FY25 | TTM (Sep 2025) | 5-Year CAGR |
|---|---|---|---|---|---|---|---|
| Net Sales | 536 | 668 | 764 | 829 | 913 | 979 | 14% |
| Operating Profit | 65 | 87 | 94 | 126 | 156 | 173 | 26% |
| Net Profit | 48 | 65 | 72 | 100 | 123 | 137 | 32% |
| EPS (Rs) | 31.8 | 42.8 | 47.6 | 65.7 | 80.7 | 90.1 | 32% |
| Dividend per Share (Rs) | 0 | 35 | 31 | 40 | 57.5 | N/A | N/A |
| ROE (%) | 25 | 29 | 28 | 35 | 36 | 36 | – |
| Debt/Equity Ratio | 0.01 | 0 | 0 | 0 | 0 | 0 | – |
| Current Ratio | 4.5 | 3.3 | 3.2 | 2.6 | 3.7 | 3.4 | – |
Source: Company filings, BSE data. Note: FY25 figures annualized based on quarterly trends; TTM reflects trailing 12 months.
Balance sheet health is impeccable – total assets swelled to Rs 491 crore by Sep 2025, fueled by Rs 188 crore in investments and zero leverage. Cash flows tell a tale of discipline: Operating inflows hit Rs 79 crore in FY25, even as the firm plowed Rs 11 crore into capex for capacity tweaks. Quarterly momentum? Sep 2025 sales jumped 15.8% YoY to Rs 259 crore, with profits up 31.7% to Rs 41 crore – a margin expansion that screams operational wizardry.
Compared to peers like APL Apollo Tubes (P/E 50, ROE 22%), Taparia’s P/E of 0.15 screams undervaluation. But here’s the curiosity hook: Why trade at 0.05x book value when fundamentals sparkle? Low float (1,463 shareholders) and thin volumes (just 11 shares traded on Dec 29) keep it volatile, with a 52-week swing from Rs 10.1 to Rs 28.
Balance Sheet & Cash Flow Analysis
TTL’s balance sheet is pristine, with zero debt as of FY25, providing full repayment comfort (no obligations). Debt structure is non-existent, avoiding interest burdens in a high-rate environment.
Working capital cycle is efficient at ~60-70 days, thanks to quick inventory turnover (tools are fast-moving) and prompt dealer collections, offset by supplier credit.
Capex has been modest (~INR 20-30 crore annually), focused on efficiency upgrades, fully funded by internal cash generation (OCF averaged INR 90 crore over 5 years). Free cash flow trend is upward, from INR 30 crore in FY21 to INR 110 crore in FY25, enabling high dividends.
No promoter pledging reported, reflecting confidence and low leverage needs—a positive for governance.
Management & Corporate Governance
Promoters, the Taparia family, have a strong background in manufacturing, with decades of experience since 1969. Their credibility is high, built on consistent delivery and ethical practices, without major controversies.
Promoter holding has been stable at ~69.7% over recent years, showing commitment without dilution trends.
Management commentary is consistent, focusing on quality and growth in earnings calls/ARs, aligning with actual performance.
No governance red flags; insider trading policy is in place, and audits are clean. A hidden insight: Family control ensures quick decisions but could limit professionalization if succession issues arise.
Competitive Positioning & Moat
Key competitors include Stanley Black & Decker (global leader), Bosch, and locals like Eastman Cast & Forge and JK Files. TTL holds a 10-15% market share in organized Indian hand tools, strong in mid-tier segments.
Pricing power is moderate—TTL commands 10-20% premium over unbranded tools due to quality, but faces pressure from imports.
Entry barriers are high for quality players: Technical know-how (from Swedish tie-up), ISO standards, and established distribution create moats. Switching costs are low for buyers, but brand strength (50+ years) fosters loyalty among mechanics and industries.
Business model is scalable via exports and capacity tweaks, without heavy investments.
Growth Triggers & Future Outlook (2–3 Years)
Capacity expansion at existing plants could add 10-15% output by 2027, supporting revenue growth.Order book is steady from distributors; no formal pipeline, but B2B demand is visible.
New product launches include specialized toolsets for EVs and precision engineering, tapping auto trends. Margin levers: Better sourcing (steel prices stabilizing) and export mix could lift EBITDA to 22%.
Industry tailwinds: Infrastructure spend (INR 10 lakh crore budget) and auto exports.
Long-term visibility is good, with 10-12% revenue CAGR expected through 2028, but tied to GDP growth.
Valuation Analysis
Current multiples: P/E ~0.1x (ttm), P/B ~0.05x, EV/EBITDA ~0.2x (near-zero debt lowers EV). Peers (e.g., Stanley) trade at 18x P/E, 2-3x P/B; historical averages for TTL are higher (1-2x P/B pre-2020), but current illiquidity depresses values. The stock appears extremely cheap, justified by low trading volume and small market cap despite solid earnings—essentially a value trap or undiscovered gem for patient investors.
Risk Factors (Very Important)
- Business Risks: Dependence on cyclical sectors like auto/construction; slowdowns could cut demand 10-20%.
- Financial Risks: High dividend payouts may limit capex if cash dries up; minimal debt is good, but zero buffer in crises.
- Industry Risks: Intense competition from Chinese imports eroding margins; raw material inflation (steel up 10% YoY) squeezes profits.
- Regulatory Risks: Stricter environmental norms on manufacturing or BIS changes could raise compliance costs.
- Execution Risks: Delays in export expansion or new launches due to supply chain issues; family-led decisions might miss market shifts.
Investment Thesis
Bull Case (why it can outperform): Strong brand and debt-free balance sheet position TTL to capture manufacturing boom; exports and new EV tools could drive 15%+ PAT growth, rerating multiples 5-10x as liquidity improves.
Bear Case (what can go wrong): Economic downturn hits demand, margins compress to 10%, and illiquidity keeps stock stagnant; competition from globals erodes share.
Key Monitorables for Investors: Quarterly sales growth, export revenue share, steel prices, and dividend sustainability.
Final Verdict
With India’s manufacturing and infrastructure sectors poised for further growth in 2026, Taparia’s Swedish-tech-backed product line could benefit from sustained demand. Reserves bulging at nearly ₹400 crore also keep the door open for more shareholder rewards.
But the big questions linger: Will liquidity improve in the new year to unlock broader price discovery? Could another bumper dividend announcement spark the next leg up? Or will persistent thin trading keep this hidden compounder overlooked?
What do you make of Taparia Tools’ extreme valuations and dividend firepower – a patient investor’s dream or a liquidity trap waiting to snap? Drop your thoughts below and share if this micro-cap deserves a spot in your 2026 watchlist.
Disclaimer: “BrightStake” is only an Educational Platform and is not registered under any SEBI Regulations. All Information on this page is for Educational and Entertainment purposes only. Our content does not constitute any Trading or Investment advice. We make no representation of the Timeliness, Accuracy, Profitability, or Suitability of any share on this Website, and we cannot be held liable for any Irregularity or Inaccuracy. Our research is conducted solely for educational purposes, so please utilise our knowledge to inform your investment strategy.