
S&S Power Switchgear: From Legacy Sparks to High-Voltage Growth – Is This Small-Cap Ready to Electrify Portfolios in 2026?

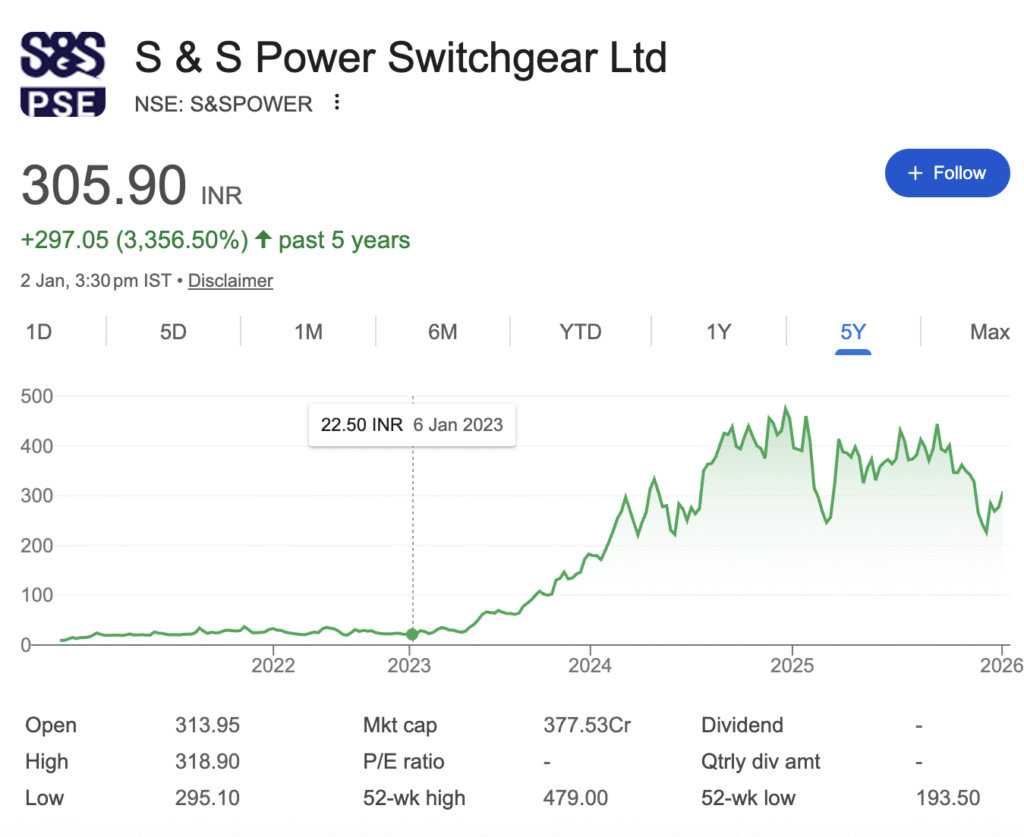
In the electrifying world of India’s power transmission and distribution (T&D) sector, where renewable energy ambitions and grid modernization are fueling a multi-trillion-rupee boom, one mid-tier player is quietly amping up its game. S&S Power Switchgear Ltd (NSE: S&SPOWER, BSE: 517273), a 50-year-old veteran in switchgear and control equipment, has been grabbing headlines with blockbuster order wins and a bold three-year roadmap. But with its stock swinging wildly—from a 52-week low of Rs 193.50 in early December 2025 to a recent spike above Rs 300—investors are asking: Is this a high-potential turnaround story or a risky short-circuit waiting to happen?
A record order intake of over Rs 300 crore in FY25, up 67% year-on-year, including a Rs 30-crore international contract for pot control systems in Egypt and a Rs 9-crore deal from Godrej & Boyce for isolators in Power Grid Corp projects. These wins underscore S&S Power’s niche in sustainable tech, like aluminium smelter controls, amid surging global demand for recyclable metals and green energy infrastructure.
1. Business Overview
S&S Power Switchgear Ltd. (S&SPOWER) is an established, 50-year-old Indian engineering firm incorporated in 1975, operating in the power transmission and distribution (T&D) and industrial automation sectors. The company and its group entities design, manufacture, and service critical electrical equipment like high-voltage disconnectors, protection and control panels, and automation systems for aluminium smelters.
- Core Business Segments: The group operates through three main subsidiaries:
- S&S Power Switchgear Equipment Ltd. (Chennai): Focuses on high-voltage disconnectors (up to 420kV) and associated services.
- Acrastyle Ltd. (UK): A UK-based system integrator specializing in protection, control, and relay panels.
- Hamilton Research & Technology (HART, Kolkata): Provides proprietary automation hardware and software solutions for the global aluminium industry.
- Revenue Contribution: Consolidated financials do not break down segmental revenue clearly. However, the UK subsidiary (Acrastyle) was highlighted as a standout performer in recent quarters.
- Presence: The group has a meaningful international footprint, with manufacturing/operations in India and the UK, and products deployed in over 50 countries.
- Business Model (Simplified): S&S Power is an engineering-led equipment manufacturer and system integrator. Its model involves securing contracts (orders) from utilities, network operators, and industrial companies, then designing, sourcing components, assembling, testing, and delivering customized electrical systems. Revenue is recognized upon project execution and delivery. The recent acquisition of HART adds a high-margin, software-centric, niche technology layer to this model.
2. Industry & Sector Analysis
- Industry Size & Growth: The Indian T&D equipment market is driven by massive government spending on grid modernization, renewable energy integration, and rural electrification. The sector is in a long-term growth cycle, supported by the need for reliable power infrastructure.
- Key Demand Drivers: Government capex (Power Grid Corp. of India), renewable energy projects (solar/wind farms requiring substations), industrial capex, and exports to developing economies.
- Government Policies/Regulations: Policies are a net positive. Initiatives like the Revamped Distribution Sector Scheme (RDSS) and focus on “Make in India” for defence and infrastructure provide a strong tailwind for domestic manufacturers.
- Competitive Intensity (Porter’s Five Forces – Simplified):
- Threat of New Entrants: Low to Moderate. The sector requires technical know-how, certifications, and customer trust, creating barriers. However, it is not immune to new, well-funded competitors.
- Bargaining Power of Suppliers: Moderate. The company sources standardized electrical components from multiple suppliers, limiting individual supplier power.
- Bargaining Power of Buyers: High. Customers (large utilities, EPC companies) are concentrated, price-sensitive, and have multiple vendors to choose from, squeezing margins.
- Threat of Substitutes: Low. Core T&D equipment has no direct substitutes. The threat lies in competing technologies (e.g., gas-insulated switchgear vs. air-insulated).
- Competitive Rivalry: Very High. S&S Power competes with large, entrenched players like Siemens, ABB, GE, and CG Power, as well as numerous smaller domestic firms, leading to intense price competition.
- Industry Cycle Positioning: Mid-Cycle Growth. The industry is past initial recovery and is in a sustained expansion phase fueled by infrastructure spending, though cyclicality remains.
3. Financial Performance Deep Dive (5 Years)
The financial track record is marked by volatility and recent stress, overshadowing top-line growth.
- Quality of Earnings: Low. Profitability is inconsistent and heavily impacted by exceptional items. For instance, FY2023’s positive PAT was significantly aided by an exceptional income of ₹10.05 Cr. Recent quarters show profits are not generated from core operations but from other income and tax adjustments.
- Margin Contraction/Expansion Reasons: Margins are volatile due to product mix changes, raw material cost fluctuations, intense competition, and likely low-margin project wins. The integration of HART (high-margin tech) and growth in UK operations could be future margin levers.
- Red Flags:
- Consistent Losses & Negative ROE/ROCE: The primary red flag is the inability to generate stable profits and adequate returns on capital over a cycle.
- Negative Interest Coverage Ratio: The company’s earnings are insufficient to cover its interest expenses, a sign of financial stress.
- Erratic Cash Flows: Volatile operating cash flows suggest challenges in converting profits into cash, often a working capital issue.
4. Balance Sheet & Cash Flow Analysis
- Debt Structure & Repayment Comfort: The standalone debt-to-equity ratio has improved to 0.2 as of Mar-2025, which is manageable. However, the negative interest coverage ratio is a major concern, indicating operating profits are inadequate to service even this level of debt. Repayment comfort is low without a sharp improvement in profitability.
- Working Capital Cycle: The cycle is long and inconsistent. Debtor days are high (~88-1668 days based on different sources), indicating slow collection from customers. Inventory days are also elevated (~148 days). This ties up significant capital.
- Capex vs. Cash Generation: Recent years (FY2025) show heavy negative investing cash flow (-₹52.61 Cr), funded by financing activities (₹54.93 Cr), indicating significant capex or acquisitions funded by raising capital or debt, not from internal cash generation.
- Free Cash Flow Trend: Free Cash Flow (Operating CF – Capex) has been persistently negative or negligible over the years, meaning the company does not generate surplus cash for shareholders after maintaining its business.
- Promoter Pledging: No promoter pledging is reported, which is a positive governance sign and reduces downside risk from forced selling.
5. Management & Corporate Governance
- Promoter Background & Credibility: The company is promoter-driven with a high promoter holding of ~75%, aligning interests with minority shareholders. Mr. Ashish Jalan, the promoter and Chairman, has been associated with the company for decades. Credibility is tempered by the company’s long-term financial performance.
- Promoter Holding Trend: The holding has remained stable and high, a positive signal of commitment.
- Management Commentary Consistency: Recent communications focus on a new 3-year strategic plan, restructuring, and integrating HART. The narrative is forward-looking but has yet to be validated by consistent financial delivery.
- Related Party Transactions: The latest financials indicate transactions, including shareholding through “Hamilton and Co. Ltd.” (a promoter group entity). Investors must scrutinize annual report notes for fairness.
- Governance Red Flags: The major red flag is persistent underperformance under the same leadership. While no glaring governance scandals are evident, the inability to generate shareholder returns is a fundamental governance concern.
6. Competitive Positioning & Moat
- Key Competitors: Faces competition from global giants (Siemens, ABB, Hitachi Energy) and strong domestic players (CG Power, GE T&D India) in its core segments.
- Market Share: A small player in the fragmented Indian T&D market. Its niche strength lies in specific high-voltage disconnectors and the newly acquired proprietary aluminium plant automation (HART).
- Pricing Power: Low. As a smaller player in a competitive market with large, commodity-like products, it has little pricing power, as evidenced by thin and volatile margins.
- Entry Barriers / Switching Costs: Moderate in the core business. The business requires technical approvals, a track record, and customer relationships. However, High for HART’s niche, where deep domain expertise and proprietary software create higher switching costs for clients.
- Scalability of Business Model: The traditional equipment model is scalable but capital-intensive with low incremental margins. The HART technology business is potentially more scalable with higher margins if successfully marketed globally.
7. Growth Triggers & Future Outlook (2–3 Years)
- Capacity Expansion: The UK subsidiary (Acrastyle) has begun a brownfield expansion to increase capacity by ~100% in phases through 2027, indicating management confidence in demand.
- Order Book / Pipeline: Management reports a record consolidated order book, with Acrastyle at ~₹180 Cr and SSPSE at ~₹90 Cr, providing near-term revenue visibility. HART’s first major international order (USD 3.5M from Egypt) is a key breakthrough.
- New Product Launches: Commercialization of 765kV disconnectors and development of a “Digital Twin” system for simulation are in progress.
- Margin Levers: Successful integration and scaling of high-margin HART business, better product mix from exports, and operating leverage from higher UK capacity utilization.
- Industry Tailwinds: Strong government and private capex in power infrastructure and industrial automation provide a conducive macro environment.
- Long-term Visibility: Visibility is moderate, backed by a healthy order book. Long-term success hinges on execution of the strategic plan, margin improvement, and achieving the stated FY2028 targets of 2x revenue and 12-15% EBIDA margins.
8. Valuation Analysis
- Current Valuation Multiples:
- Comparison with Peers & Historical Averages: Trading at a premium to its own book value (P/B of ~4.7x vs. historical norms). Compared to profitable, high-quality peers like Siemens or ABB India (which trade on P/E), a direct multiple comparison is invalid due to S&SPOWER’s lack of profits.
- Cheap, Fair, or Expensive? Based on conventional metrics and its financial history, the stock appears expensive. The market is valuing its future potential and order book, not its current earnings power.
- Valuation Justification (Simple Terms): The current price can only be justified if an investor believes the company’s new strategic plan will be perfectly executed. It assumes a successful turnaround from a history of volatility to achieving high growth and double-digit margins. This is a high-risk, high-potential reward bet.
9. Risk Factors (Very Important)
- Business & Execution Risks: High. The core risk is the failure to execute the growth strategy and improve profitability. Integration risks with HART, project execution delays, and cost overruns are ever-present.
- Financial Risks: High. Negative interest coverage, erratic cash flows, and a history of losses constitute significant financial risk. The company remains vulnerable to any economic downturn or working capital squeeze.
- Industry Risks: Moderate. Intense competition, cyclicality in capex, and input cost inflation are standard industry risks.
- Regulatory Risks: Low. The sector is regulated, but policies are currently favourable.
- Valuation Risk: High. The premium valuation leaves little margin for error. Any disappointment in execution could lead to severe price correction.
10. Investment Thesis
- Bull Case (Why it can outperform): The new management’s strategic plan is executed flawlessly. HART becomes a high-margin cash cow, UK operations scale profitably, and the consolidated entity achieves its FY2028 targets of 20%+ CAGR revenue and 12-15% EBIDA margins. The stock re-rates as it demonstrates consistent profitability, justifying its premium.
- Bear Case (What can go wrong): The company fails to break its cycle of volatile earnings. Margin improvement does not materialize due to competition, integration challenges, or execution issues. The order book fails to convert into profits. Continued cash flow strain leads to further balance sheet stress. The stock de-rates sharply as the turnaround story fades.
- Key Monitorables for Investors:
- Quarterly Consistency: Sequential improvement in EBITDA and PAT margins, moving towards double-digits.
- Cash Flow Generation: Conversion of profits into positive and growing operating cash flow.
- Order Book Quality: Sustained order inflow and commentary on execution profitability.
- Debt and Interest: Reduction in gross debt and achievement of a positive interest coverage ratio.
11. Final Verdict
- Suitable for: Long-term, speculative capital only. Not suitable for SIP or short-term trading.
- Investor Profile: Aggressive. This is a high-risk, high-potential “turnaround” bet. It is unsuitable for conservative or moderate investors who require stability, consistent profits, or dividends.
- Clear Conclusion: S&S Power Switchgear presents a classic dichotomy: a promising narrative of restructuring, niche technology, and strong order books, set against a challenging reality of historical financial volatility and weak shareholder returns. The investment decision hinges entirely on one’s belief in management’s ability to execute a transformative strategic plan. For most retail investors, the combination of high financial risk, unproven execution, and premium valuation suggests a cautious approach. It is a stock to monitor closely for concrete, sustained evidence of a fundamental profitability turnaround before considering an investment.
Disclaimer: “BrightStake” is only an Educational Platform and is not registered under any SEBI Regulations. All Information on this page is for Educational and Entertainment purposes only. Our content does not constitute any Trading or Investment advice. We make no representation of the Timeliness, Accuracy, Profitability, or Suitability of any share on this Website, and we cannot be held liable for any Irregularity or Inaccuracy. Our research is conducted solely for educational purposes, so please utilise our knowledge to inform your investment strategy.