
Marsons Ltd Soars 2% After Bagging ₹9 Crore Power Transformer Order
Mumbai, 4 Feb 2026 (IST) – Shares of Marsons Ltd (BOM: 517467), a player in the power equipment sector, jumped nearly 2% in intraday trading today, buoyed by a significant new order win. The stock climbed to a high of ₹145 before settling around ₹144.25, marking a gain of ₹2.80 (1.98%) from the previous close.
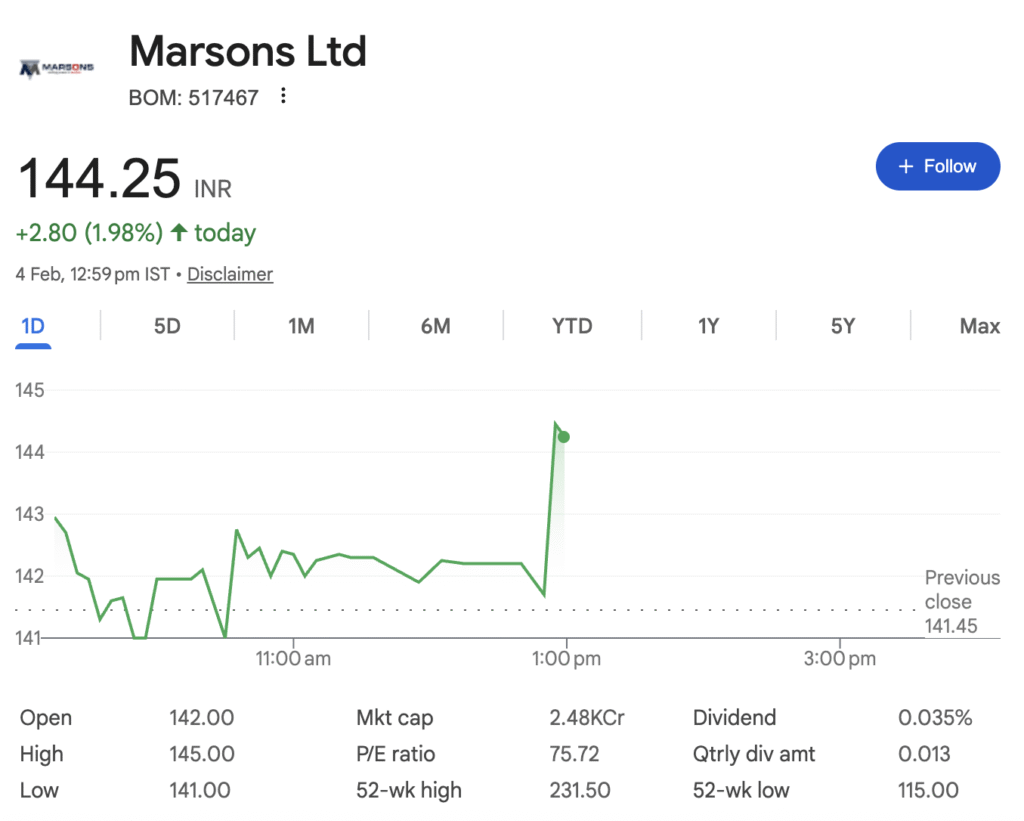
The rally followed a formal disclosure to the Bombay Stock Exchange (BSE) in which Marsons announced it has secured a purchase order worth ₹9.02 crore (including GST) from Sugan Lloyd Limited. The order entails the supply of 10 MVA, 33/11 KV Power Transformers with On-Circuit Tap Changer (OCTC) technology.
The Financial Metamorphosis: From Ashes to…?
The raw numbers tell a story of explosive, almost unbelievable, recovery. However, this “growth” emerges from an extremely low base, a critical context often lost in the percentage figures.
Table 1: The Stunning Turnaround – Key Financial Metrics
This performance has not gone unnoticed. The stock is up approximately 242% over the past three years. Yet, a decade-long X-ray reveals a troubled past. An analysis of its financial track record shows the company “has not performed well [for the] majority of the past ten years”, marked by negative net worth, erratic sales, and periods of significant loss.
The Valuation Conundrum: Pricing Perfection or Irrational Exuberance?
This is where the investment thesis gets contentious. The market is pricing Marsons as if its recent hyper-growth is the new normal.
Table 2: The Valuation Puzzle – A Red Flag or a Premium for Growth?
A critical warning sign emerges from cash flow statements. Despite reported profits, the company has consistently generated negative free cash flows and cash from operations in recent quarters. This disconnect between profits and cash generation is a classic red flag, indicating potential working capital strain or differences in revenue recognition.
The Growth Engine: Real Momentum or One-Time Spike?
The future hinges entirely on Marsons’ ability to maintain its order inflow and convert it profitably. Here, recent data is encouraging. Beyond the Sugs Lloyd order, the company has announced a flurry of contracts in recent months, including a ₹25.85 crore order from West Bengal State Electricity Distribution Company and a ₹25.03 crore order from Galaxy Solar Energy.
This aligns with powerful sectoral tailwinds—India’s push for grid modernization, renewable energy integration, and industrial capex revival. However, the company operates in a competitive space against established players like Siemens, ABB, and CG Power.
Investment Verdict: High-Stakes Speculation
The Bull Case:
Marsons is a classic micro-cap (M-Cap: ~₹2,434 Cr) turnaround play. Its debt-free balance sheet, roaring sales growth, sector tailwinds, and steady order announcements paint a picture of a company that has fixed its fundamentals. If it can sustain even a fraction of its current growth rate, today’s high valuation may be justified in hindsight.
The Bear Case:
The valuation is untethered from reality. A P/E over 75x for a cyclical industrial company is unsustainable. The negative cash flows, lack of analyst coverage, and volatile stock price (52-wk range: ₹115 – ₹231.5) signal high risk. The spectacular growth is from a near-zero base and may not be repeatable.
Bottom Line: Marsons is a fascinating corporate revival story caught in a speculative market frenzy. While the business shows genuine signs of recovery, the stock price appears to have sprinted far ahead of the fundamentals. Investors should prioritize business proof over stock price promise. The upcoming board meeting on February 9th to declare quarterly results will be the next critical test.
Disclaimer: “BrightStake” is only an Educational Platform and is not registered under any SEBI Regulations. All Information on this page is for Educational and Entertainment purposes only. Our content does not constitute any Trading or Investment advice. We make no representation of the Timeliness, Accuracy, Profitability, or Suitability of any share on this Website, and we cannot be held liable for any Irregularity or Inaccuracy. Our research is conducted solely for educational purposes, so please utilise our knowledge to inform your investment strategy.