
Vaibhav Global Ltd: This Undervalued Gem Reports 42% YOY PAT Growth, Declares Dividend of ₹1.50/share. Is this a next Multibagger?
In the dynamic world of retail, where digital disruption is the norm, Vaibhav Global Ltd (VGL) presents a fascinating case study of a legacy model not just adapting but thriving. The company, a vertically-integrated digital retailer of fashion jewellery and lifestyle products, recently unveiled its Q3 FY26 scorecard. The numbers are more than just figures on a page; they tell a story of robust financial health, strategic digital pivot, and a growth engine firing on all cylinders. Should this stock be on your radar? Let’s dissect it from the bottom up.
The Financial Engine: Unpacking the Q3 FY26 Powerhouse
At its core, investment is about cash flow, margins, and sustainable growth. VGL’s latest quarterly report card excels on these fundamental parameters. The table below breaks down the performance with scroll-stopping specificity:
| Metric | Q3 FY26 Performance | YoY Growth % | Why It Matters |
|---|---|---|---|
| Revenue from Operations | ₹1,066 Crores | +9.1% | Consistent top-line growth despite global macroeconomic headwinds. |
| Gross Margin (GM) | 63% | ~170 bps improvement | Industry-leading. Reflects power of vertical integration—controlling design, sourcing, and manufacturing. |
| Profit After Tax (PAT) | Not Disclosed (Absolute) | +41% | Explosive bottom-line growth, outpacing revenue, indicating operational efficiency and leverage. |
| Operating Cash Flow (OCF) | ₹160 Crores | +105% | The standout metric. Converts profits into real cash powerfully, funding growth without debt. |
| Free Cash Flow (FCF) | ₹143 Crores | +165% | Financial fortress. Signals strong self-sustainability and ability to reward shareholders. |
| Interim Dividend | ₹1.50 per share | – | 28% payout for the quarter; demonstrates commitment to shareholder returns. |
| Digital Contribution | 42%+ of Group Revenue | Growing | Successful omnichannel shift reducing dependency on traditional TV retail. |
Segment-Wise Vigor: The growth is broad-based. The USA (largest market) saw 8.7% revenue growth, the UK grew 8.2%, and Europe surged 14.0%. The retail segment EBITDA grew a healthy 20.9%, showcasing profitable expansion.
1. Business Overview
- Company Background & History: Founded in 1989, VGL began as a B2B gemstone and jewellery exporter to major retailers like Walmart and Macy’s. A pivotal shift occurred post the 2008 financial crisis when it pivoted from premium physical retail to a deep-discount, vertically integrated B2C model via TV shopping. It was listed in 1996-97.
- Core Business Segments: The company operates as an integrated retailer with two primary activities:
- Revenue Contribution by Segment (9M FY25): USA (~59%), UK (~30%), Europe (~11%). The manufacturing/sourcing segment contributes revenue but is largely eliminated in consolidation as it supplies the retail arm.
- Presence: Global retail footprint with core markets in the US, UK, and Germany. Sourcing and manufacturing are global, with a network across 30+ countries and key operations in India.
- Business Model Explained Simply: VGL controls the entire chain. It designs products, sources materials globally, manufactures in its own or partner factories, and sells directly to consumers through its own TV shopping channels (Shop LC, TJC) and digital platforms (websites, apps). This “factory-to-sofa” model cuts out middlemen, allowing it to offer lower prices while protecting its margins.
2. Industry & Sector Analysis
- Industry Size & Growth Rate: VGL operates at the intersection of the global teleshopping industry (~$50 Bn, growing at a modest ~2% CAGR) and the massive global e-commerce industry (trillions of dollars, growing at 8-10% CAGR).
- Key Demand Drivers: 1) Discretionary consumer spending in the US and UK. 2) Aging Western demographics (Baby Boomers & Gen X), who watch more TV and hold significant wealth. 3) The secular shift to online shopping.
- Government Policies / Regulations: Subject to international trade policies, broadcasting regulations in the US/UK/EU, and e-commerce and data privacy laws (like GDPR).
- Competitive Intensity (Porter’s Five Forces):
- Rivalry (High): Faces competition from large teleshopping networks (QVC), e-commerce giants (Amazon, Temu), and discount fashion retailers (Shein).
- Threat of New Entrants (Low for Integrated Model): High barriers to replicate its full vertical integration and broadcast capabilities.
- Bargaining Power of Suppliers (Low): Mitigated by its global, diversified sourcing base across 30+ countries.
- Bargaining Power of Buyers (High): Consumers have infinite choice online; VGL competes on unique designs, value, and convenience.
- Threat of Substitutes (High): Fashion jewellery is a discretionary purchase with many alternatives.
- Industry Cycle Positioning: The teleshopping industry is in a structural decline due to the rise of e-commerce and changing media consumption habits. VGL is positioned in the mature-to-declining phase of TV retail but the growth phase of digital commerce.
3. Financial Performance Deep Dive (5 Years)
Key Financial Metrics (Consolidated)
| Fiscal Year | Revenue (₹ Cr) | Revenue Growth | EBITDA Margin | PAT Margin | ROE | ROCE | Debt-to-Equity | OCF (₹ Cr) | EPS (₹) |
|---|---|---|---|---|---|---|---|---|---|
| 2021 | 2,540 | 27.9% | 14.6% | 10.7% | ~29%* | 35%* | Very Low | 326 | 16.70 |
| 2022 | 2,752 | 8.3% | 10.2% | 8.6% | ~22%* | 22%* | Very Low | 88 | 14.50 |
| 2023 | 2,691 | -2.2% | 7.4% | 3.9% | ~9%* | 14%* | Very Low | 127 | 6.36 |
| 2024 | 3,041 | 13.0% | 8.8% | 4.2% | ~10%* | 15%* | 0.09 | 277 | 7.72 |
| 2025 | 3,380 | 11.1% | 8.6% | 4.5% | 12.0% | 14.0% | 0.08 | 165 | 9.22 |
| TTM (Sep ’25) | 3,518 | – | 8.8% | 5.2% | 11.7% | 14.0% | N/A | N/A | 11.00 |
- Quality of Earnings: Earnings are backed by strong operating cash flows, which have consistently been positive and significantly higher than net profit in recent years, indicating high-quality earnings.
- Margin Expansion or Contraction Reasons: Margins contracted sharply from pandemic highs (FY21) due to increased investment in digital capabilities, marketing, and integration of acquisitions (Mindful Souls, Ideal World assets). Recent quarters show stabilization and modest improvement as these investments mature.
- Red Flags (if any):
4. Balance Sheet & Cash Flow Analysis
- Debt Structure & Repayment Comfort: The company has a robust balance sheet with a net cash position of ₹1.29 billion (as of Sep 2025). Consolidated Debt-to-Equity is very low at 0.08-0.09. Repayment risk is minimal.
- Working Capital Cycle: The Cash Conversion Cycle is long (~181 days), primarily driven by high Inventory Days (~219 days). This is typical for a business holding vast jewellery inventory but requires efficient management.
- Capex vs Cash Generation: The business is not capital intensive. Annual capex is manageable, and the company has historically generated strong free cash flow (FCF). In the last three years, FCF conversion from EBIT was a robust 86%.
- Free Cash Flow Trend: FCF has been positive and volatile, reflecting working capital movements. The underlying ability to generate cash from operations remains strong.
- Promoter Pledging (if any): There is no promoter pledging of shares, which is a significant positive from a corporate governance and risk perspective.
5. Management & Corporate Governance
- Promoter Background & Credibility: Founded and led by Mr. Sunil Agrawal, who has steered the company for over 35 years through multiple business model transitions. His experience in gems, jewellery, and global retail is a key asset.
- Promoter Holding Trend: Promoter holding is stable. The company is a subsidiary of Brett Enterprises Private Limited.
- Management Commentary Consistency: Commentary has consistently focused on the digital pivot, brand building, and achieving operating leverage from past investments, which aligns with observable strategy.
- Related Party Transactions: Investors should review the annual report for details. Given the global subsidiary structure, some transactions exist but need scrutiny for fairness.
- Governance Red Flags (if any): No major red flags. The company has received awards for corporate governance and is a Great Place to Work® certified organization across multiple countries.
6. Competitive Positioning & Moat
- Key Competitors Comparison: Competes with teleshopping leaders (QVC, HSN), global e-commerce platforms (Amazon), and specialty fashion retailers (Claire’s Stores, Shein).
- Market Share: A niche but profitable player in the value-focused teleshopping and e-commerce jewellery segment in its core markets.
- Pricing Power: Moderate. Its vertically integrated model allows it to be a low-cost producer and offer deep value, but it does not have brand-driven premium pricing power.
- Entry Barriers: High for its integrated model. Barriers include: 1) Vertical Integration Moat (decades to build supply chain), 2) Licensed TV Broadcasting Access in key markets, 3) Established Customer Base.
- Switching Costs / Brand Strength: Low switching costs for consumers, but it builds loyalty through its “value-for-money” proposition and omnichannel experience. It is building brand strength via its in-house labels.
- Scalability of Business Model: The digital platform is highly scalable geographically. The TV model is scalable within regions but faces growth constraints due to the industry’s decline.
7. Growth Triggers & Future Outlook (2–3 Years)
- Capacity Expansion: Growth is not reliant on physical capacity but on channel reach and digital capabilities.
- Order Book / Pipeline: As a retailer, it does not have an order book. The “pipeline” consists of planned product launches and marketing campaigns.
- New Product Launches: Core to its model, launching ~100 new products daily across jewellery and lifestyle categories to maintain freshness.
- Margin Levers: 1) Operating leverage from higher digital sales. 2) Sourcing efficiencies from its global network. 3) Product mix shift toward higher-margin in-house brands.
- Industry Tailwinds: The continued growth of e-commerce and the stable spending power of an ageing Western population, who are its core TV audience.
- Long-term Visibility: Moderate. Visibility on margins is better due to its integrated model. Revenue visibility is lower due to its exposure to discretionary spending and the competitive digital landscape.
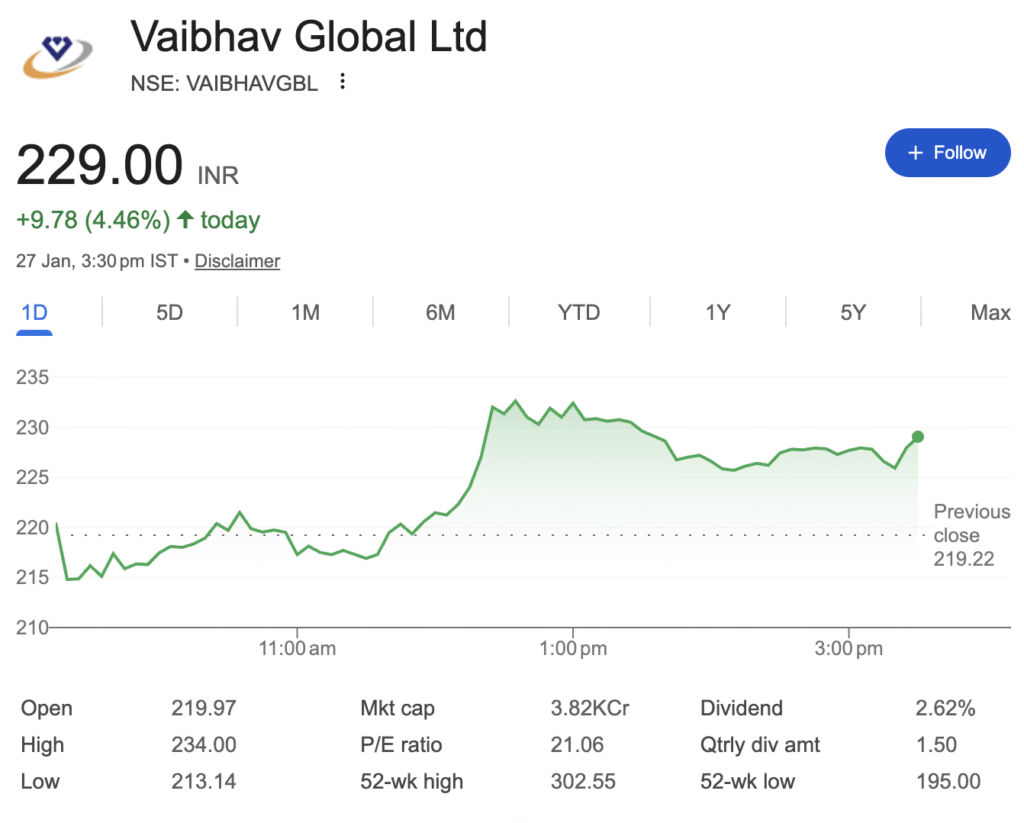
8. Valuation Analysis
- Current Valuation Multiples (P/E, P/B, EV/EBITDA):
- Comparison with Peers & Historical Averages: The current P/E of ~20.7x is near the lower end of its historical range (5-year stock price CAGR is -15%). It trades at a discount to many Indian retail peers but operates in a different (slower growth) industry.
- Is the Stock Cheap, Fairly Valued, or Expensive?: Appears fairly valued to slightly undervalued based on its own history and financial strength. Some intrinsic value models suggest an undervaluation of 31-45%.
- Valuation Justification in Simple Terms: The market is applying a moderate valuation that reflects the company’s strong cash generation and clean balance sheet, but is also discounting for the challenging growth outlook in its core TV business and competitive digital space.
9. Risk Factors (Very Important)
- Business Risks: 1) High customer concentration in the US and UK. 2) Structural decline of the teleshopping industry. 3) Failure to grow digital revenue sufficiently to offset TV declines.
- Financial Risks: 1) Foreign exchange volatility (revenue in USD/GBP, costs in INR/others). 2) Inventory obsolescence risk due to fashion trends and high inventory levels.
- Industry Risks: 1) Intense competition from global e-commerce and fast-fashion players. 2) Rising customer acquisition costs in digital marketing.
- Regulatory Risks: Changes in data privacy laws, broadcasting rights, or international trade tariffs.
- Execution Risks: Mismanaging the balance between investing in growth (digital) and milking the cash cow (TV).
10. Investment Thesis
- Bull Case (Why It Can Outperform): 1) Successful digital transition leads to re-rating as a profitable omnichannel retailer. 2) Strong operating leverage kicks in, boosting margins as recent investments pay off. 3) Its net cash balance sheet provides resilience and options for buybacks/acquisitions. 4) A stable economic environment in the US/UK supports discretionary spending.
- Bear Case (What Can Go Wrong): 1) Recession in core markets severely impacts discretionary spending. 2) Digital growth stalls while TV revenue declines faster than expected, leading to overall revenue contraction. 3) Margin pressure from sustained high competition and marketing costs.
- Key Monitorables for Investors: 1) Digital Revenue Growth % and Contribution. 2) Overall Revenue Growth trajectory. 3) EBITDA Margin trend. 4) Updates on customer base and engagement metrics.
11. Final Verdict
- Clear Conclusion: Vaibhav Global is a fundamentally strong company with a unique model, trading at reasonable valuations. It offers a compelling case based on its financial discipline, cash generation, and strategic evolution. However, it operates in a challenging industry segment, making its growth path uncertain. Investment success hinges almost entirely on the management’s ability to accelerate digital growth and manage the TV business decline effectively. It is a “show me” story where investors must monitor execution closely.
Disclaimer: “BrightStake” is only an Educational Platform and is not registered under any SEBI Regulations. All Information on this page is for Educational and Entertainment purposes only. Our content does not constitute any Trading or Investment advice. We make no representation of the Timeliness, Accuracy, Profitability, or Suitability of any share on this Website, and we cannot be held liable for any Irregularity or Inaccuracy. Our research is conducted solely for educational purposes, so please utilise our knowledge to inform your investment strategy.