
Varvee Global: Debt-Free Revival Ignites 80% Revenue Surge – Is This Textile Underdog Your Next Multibagger?
Imagine a company drowning in debt and losses just a year ago, now boasting near-zero borrowings, sky-high margins, and a profit explosion that has promoters doubling down. That’s the electrifying turnaround at Varvee Global Ltd (NSE: VGL), the denim powerhouse formerly known as Aarvee Denims & Exports. Acquired in 2024 by textile tycoon Jaimin Gupta, this small-cap stock has shed its baggage, posting an 80% revenue jump in Q2 FY26 while slashing costs to deliver a jaw-dropping 49.8% EBITDA margin. But with shares up 42% in a year, is the rally just beginning—or a trap for the unwary investor?
As global fashion giants chase sustainable denim amid a post-pandemic apparel boom, Varvee Global’s integrated mills in Gujarat are positioned to capture export dollars. Yet, whispers of volatile cotton prices and fierce competition from Bangladesh loom. We dive deep into the numbers, dissecting finances bottom-up to reveal if VGL deserves a spot in your portfolio—or a swift sell.
1. Business Overview
Varvee Global Ltd. (formerly Aarvee Denims and Exports Ltd.) is a Gujarat-based, integrated textile manufacturer with a 35+ year history. Following a strategic acquisition by a new management team in September 2024, the company is executing a sharp pivot from a financially stressed entity to a focused, operationally efficient platform.
- Core Business Segments & Revenue: The company’s operations are consolidated into an integrated fabric manufacturing model. It produces:
- Denim Fabrics: Its traditional core, offering products like satin, high-fashion, and flat-finish denims.
- Non-Denim Fabrics: A strategic growth focus, including shirting and suiting fabrics. The new management is actively shifting capacity from denim to these higher-margin categories.
- Presence: The company operates from a single, centralized manufacturing facility in Narol, Ahmedabad (52,000 sq. yards) . It serves both domestic and export markets, leveraging India’s position as a major cotton producer.
- Business Model Explained: VGL is a manufacturer (B2B). It buys cotton/yarn, processes it through in-house spinning, weaving, dyeing, and finishing facilities to produce finished fabrics, and sells these fabrics to apparel brands and manufacturers. The “integrated” model means it controls most stages of production under one roof, which can offer cost and quality control advantages.
2. Industry & Sector Analysis
- Industry Size & Growth: The Indian textile market is large and growing, valued at an estimated USD 146-222 billion in 2024. It is projected to reach up to USD 213.5 billion by 2033, with an aggressive export target of USD 100 billion by FY2031.
- Key Demand Drivers: 1) Rising domestic disposable income and fashion consumption, 2) Global “China Plus One” sourcing strategy diverting orders to India, 3) Government policy support (PLI schemes), 4) Abundant raw material (cotton) supply.
- Government Policies: Schemes like the Production Linked Incentive (PLI) for textiles and the PM-MITRA parks aim to boost large-scale manufacturing and exports, benefiting integrated players.
- Competitive Intensity (Simplified Porter’s Five Forces):
- Rivalry Among Existing Competitors: Very High. The industry is fragmented with numerous unorganized and listed players (e.g., Arvind, Nandan Denim).
- Bargaining Power of Buyers: High. Apparel brands have multiple sourcing options.
- Bargaining Power of Suppliers: Moderate. Dependent on cotton prices, but domestic availability helps.
- Threat of New Entrants: Low. Capital-intensive with long gestation periods.
- Threat of Substitutes: Low. Fabric is a basic commodity for apparel.
- Industry Cycle Positioning: The industry is in a growth phase, driven by long-term structural shifts in global trade and domestic policy support. However, it remains cyclical and sensitive to global economic health.
3. Financial Performance Deep Dive (5 Years)
The financial history reveals a company in deep distress now attempting a sharp turnaround. The past five years show a consistent decline, while recent quarters show a dramatic reversal.
Key Financial Metrics (Standalone)
Table: Financial Snapshot (Values in Rs. Crore unless specified)
**FY2025 profitability ratios are skewed due to drastically reduced revenue base and significant other income .*
- Quality of Earnings: The positive PAT in FY2025 and Q2FY26 requires scrutiny. For FY2025, the company reported an “other income” of Rs. 73.9 Crore against a revenue of just Rs. 42 Crore, meaning profits were not from core operations. In Q2FY26, while core EBITDA turned positive, investors must monitor if profits are sustainable from operations alone.
- Margin Expansion/Contraction Reasons:
- Past Contraction (FY21-FY24): Driven by high debt, interest costs, operational inefficiencies, and a shrinking revenue base.
- Recent Expansion (Q2FY26): Attributable to the new management’s strategy: 1) Drastic cost-cutting (employee expenses down ~54%), 2) Shift to a richer product mix, 3) Near-elimination of finance costs after debt repayment, and 4) Better realisations.
- Red Flags (Historical):
- Catastrophic Revenue Collapse: 5-year sales growth is -40.4%.
- Persistent Losses: The company reported consecutive annual losses from FY2020 to FY2024.
- Weak Balance Sheet: Historically high debt eroded the net worth, with reserves turning negative in FY2024.
4. Balance Sheet & Cash Flow Analysis
- Debt Structure & Repayment Comfort: This is the most significant change. The company became debt-free in June 2025. The debt-to-equity ratio improved from a perilous 16.14x in FY24 to 2.64x in FY25. This eliminates the finance cost drag (Q2FY26 finance cost was ₹0) and is a major positive, though the balance sheet strength needs to be rebuilt from a low base.
- Working Capital Cycle: Efficiency has improved dramatically, but from very poor levels. Debtor days improved from 430 days (FY24) to 67 days (FY25). Similarly, inventory days fell from 405 to 34 days. This indicates aggressive working capital management by the new team, freeing up trapped cash.
- Capex vs. Cash Generation: Historically, operating cash flow has been volatile and insufficient to cover investing activities, leading to negative free cash flow (FCF). The current strategy focuses on utilizing existing capacity (Narol unit) rather than heavy new capex.
- Free Cash Flow Trend: Consistently negative over the past decade due to operational losses and prior debt servicing needs. The new, profitable, and debt-free operating model aims to generate positive FCF going forward.
- Promoter Pledging: Research does not indicate current promoter pledging. Notably, promoter holdings increased by 35.1% in the last quarter, which is a strong positive signal of insider confidence.
5. Management & Corporate Governance
- Promoter Background & Credibility: The new promoter and Chairman & Managing Director, Mr. Jaimin K. Gupta, acquired control in Sep 2024. He brings a retail operator background (founder of Barcelona retail chain). The market is assigning high credibility based on the rapid execution seen in Q2FY26 results.
- Promoter Holding Trend: The sharp recent increase in promoter holding is a very strong positive signal, aligning their interests with minority shareholders .
- Management Commentary Consistency: Commentary has been focused on margin reset, debt elimination, and cash flow compounding, which aligns precisely with delivered results in Q2FY26.
- Related Party Transactions & Governance Red Flags: Specific details are not available in the provided sources. However, given the recent change in control and the company’s troubled history, investors should scrutinize future related-party transactions and ensure governance structures are robust.
6. Competitive Positioning & Moat
- Key Competitors: Includes larger players like Arvind Ltd. and Nandan Denim, and numerous smaller textile mills.
- Market Share: Likely negligible in the overall textile market, given its small scale (Rs. 42 Cr FY25 revenue).
- Pricing Power: Low. As a small player in a commoditized segment, it is likely a price-taker.
- Entry Barriers: The integrated manufacturing model has moderate capital and expertise barriers, but not insurmountable.
- Switching Costs / Brand Strength: Low for generic fabrics. The “Varvee” brand is not a consumer-facing brand.
- Scalability of Business Model: The model is scalable, especially with a debt-free balance sheet. The challenge is scaling profitably in a competitive market.
7. Growth Triggers & Future Outlook (2–3 Years)
- Capacity Re-allocation: Shifting existing loom capacity from denim to higher-margin shirting/suiting fabrics to improve blended realisations.
- Operating Leverage: The Narol facility has high fixed costs. As revenue scales from its current low base, margins could benefit from operating leverage.
- Debt-Free Growth: Ability to grow without the burden of interest costs, allowing all operating profits to flow to the bottom line or be reinvested.
- Industry Tailwinds: Benefiting from the broader “China Plus One” trend and government export incentives.
- Long-term Visibility: Currently low. The turnaround is only one quarter old. Visibility will improve with consistent execution over the next 4-6 quarters.
8. Valuation Analysis
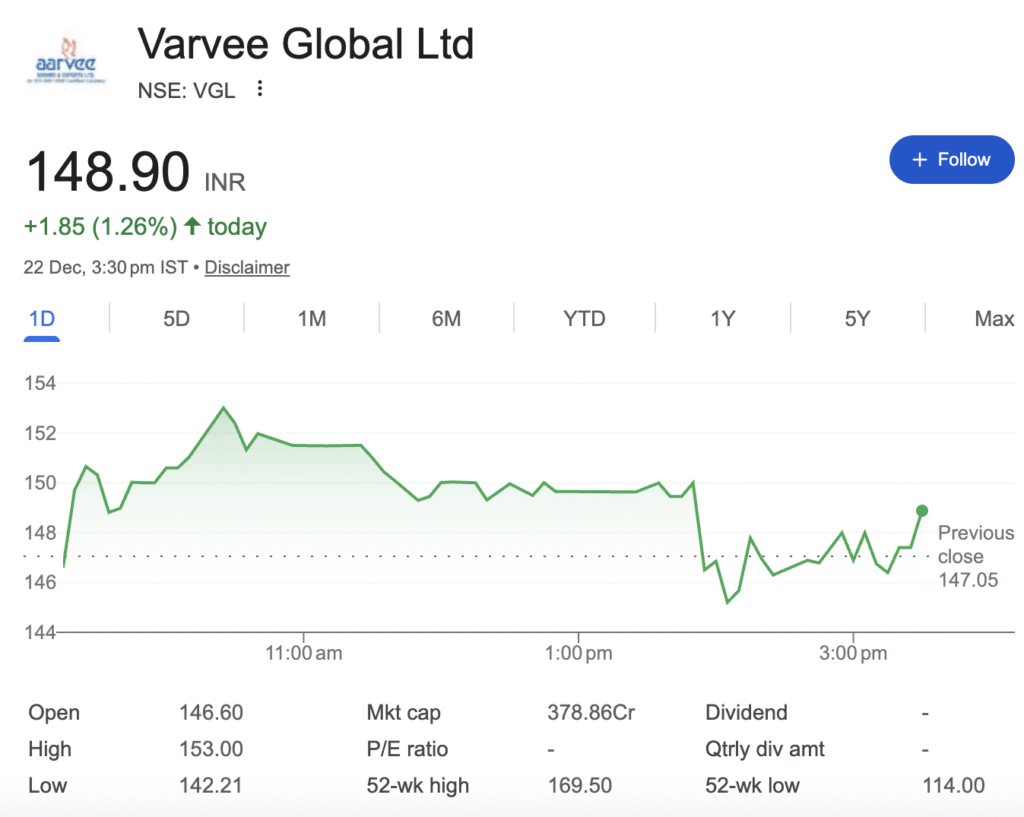
- Current Multiples (as of Dec 22, 2025):
- Comparison & Justification:
- vs. Peers: Trading at a premium to many textile peers based on P/B, justified by the market pricing in the turnaround potential and debt-free status.
- vs. Historical: The valuation is at a significant premium to its own historical averages, reflecting the changed narrative.
- Valuation Verdict: The stock is expensive on conventional metrics if viewed as a stable business. However, it is being valued as a turnaround story. The premium hinges entirely on the new management’s ability to sustain high margins and grow revenue consistently from a cleaned-up base. It’s a high-risk, high-potential-reward valuation.
9. Risk Factors (Very Important)
- Execution Risk (HIGH): The entire thesis rests on the new management’s ability to execute its plan beyond one quarter. Reverting to old inefficiencies is a key risk.
- Financial Risk (MODERATE): While major debt is repaid, the balance sheet equity is still thin from years of losses. It has low resilience to future shocks.
- Industry Risks (MODERATE-HIGH): Susceptible to global demand slowdowns, cotton price volatility, and trade policy changes.
- Business Risk (HIGH): The “growth” is from an extremely low base. Achieving scale against established competitors is challenging. The recent stellar margins (55%+ gross margin) may not be sustainable in a competitive fabric business.
- Valuation Risk (HIGH): Any stumble in quarterly execution could lead to a severe de-rating of the currently lofty multiples.
10. Investment Thesis
- Bull Case (Why it can outperform): The new management successfully scales revenue 4-5x over the next 3 years while maintaining EBITDA margins above 20% in a debt-free structure. This would lead to exponential growth in EPS, justifying and potentially expanding the current valuation multiples, resulting in multibagger returns.
- Bear Case (What can go wrong): The Q2FY26 performance proves to be a one-off, driven by one-time cost cuts and a favourable product mix that cannot be repeated. Revenue fails to grow meaningfully, margins normalize to industry averages (low-teens), and the company remains a small, marginal player. The stock could correct 50%+ from current levels.
- Key Monitorables for Investors:
- Revenue Growth in Coming Quarters: Sequential growth in topline (Rs. Cr) is more important than YoY percentages now.
- Sustainability of Margins: Can EBITDA margin stay above 15-20%?
- Cash Flow from Operations: Moving towards consistently positive and growing CFO.
- Management Guidance: Updates on capacity utilization, client additions, and new product segments.
11. Final Verdict
- Suitable for: Long-term (3+ years) speculative holding only. Not suitable for short-term trading, SIP, or conservative investors.
- Investor Profile: Aggressive investors only, with a high risk appetite and the ability to lose a significant portion of their capital.
- Clear Conclusion: Varvee Global Ltd. presents one of the most dramatic corporate turnaround stories in the recent Indian market. The change in management, complete debt elimination, and stunning margin improvement in Q2FY26 are undeniable positives. However, the company is emerging from a deep financial crisis with a severely damaged balance sheet and a history of operational failure. The current valuation prices reflect a perfect execution of the growth plan. Therefore, this is a high-conviction, high-risk bet on the new management’s execution capability, not an investment in a stable business. Investors should treat it as venture-capital-like speculation, size their position accordingly, and monitor quarterly progress meticulously.
To deepen your analysis, you may want to research the following:
- The detailed background and track record of the new promoter, Mr Jaimin K. Gupta, in his previous ventures, to better assess execution credibility.
- Granular peer comparison focusing on companies of similar size in the fabric segment to benchmark sustainable margin and return ratios.
- Global cotton price trends and forecasts, as this is the single largest raw material cost input for the business.