
From ICU to High Care: Wanbury’s Stunning Turnaround Sparks Investor Frenzy. Is This Pharma Stock a Buy?

MUMBAI – In the bustling theatre of the Indian pharmaceutical sector, where giants often dominate the spotlight, a remarkable revival story is unfolding. Wanbury Ltd. (NSE: WANBURY, BSE: 524212), once a patient in the corporate ICU, is now sprinting on the path to robust health, with its stock price skyrocketing over 69% in the past year. This isn’t just a speculative pump; it’s a fundamental re-rating backed by a surgical turnaround, de-leveraging, and a crystal-clear growth roadmap that has the market buzzing.
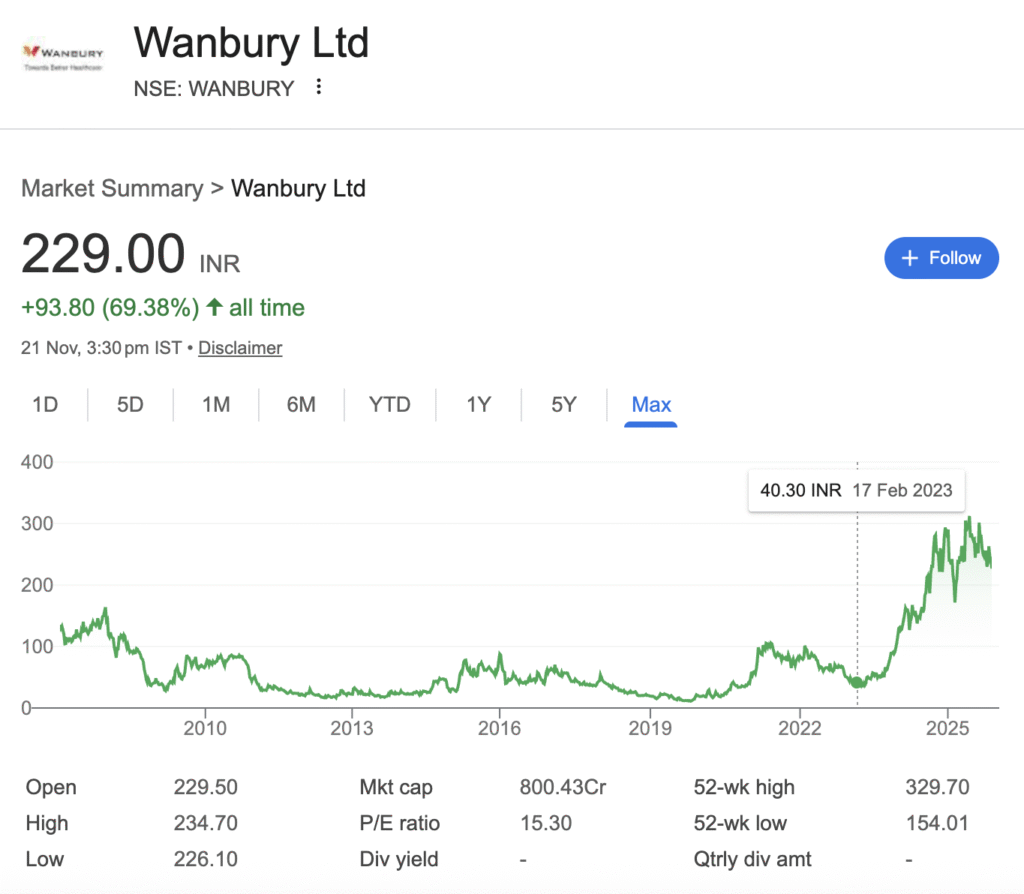
But with the stock hovering around ₹229, having touched a 52-week high of ₹329.70, the critical question for investors is: have they missed the bus, or is this journey just beginning?
The Turnaround: A Financial Phoenix Rises from the Ashes
Wanbury’s story over the last half-decade is a classic case of a successful corporate turnaround. The company was burdened by a peak debt of approximately ₹700 crores, leading to crippling finance costs and years of financial instability. However, a multi-pronged strategy involving asset sales, debt refinancing, and operational streamlining has transformed its balance sheet.
The numbers from their latest H1 FY26 earnings presentation tell a compelling tale of recovery and accelerating profitability.
Financial Snapshot: The Road to Recovery
| Metric (₹ in Crores, except margins) | FY22 | FY23 | FY24 | FY25 | H1 FY26 (Annualized) | The Analyst’s Takeaway |
|---|---|---|---|---|---|---|
| Revenue from Operations | 511.2 | 499.7 | 575.7 | 599.5 | 646.4* | Steady topline growth, with H1 FY26 indicating an acceleration. |
| EBITDA | 36.8 | 24.1 | 73.0 | 79.8 | 101.5* | 3.2x growth in 3 years. Operational efficiency is the key driver. |
| EBITDA Margin (%) | 7% | 5% | 13% | 13% | 16% | Margins are expanding dramatically, signalling improved pricing power and cost control. |
| Finance Cost | 20.6 | 21.4 | 29.2 | 37.0 | 29.3* | Refinancing high-cost debt is starting to pay off, with future reductions expected. |
| Profit After Tax (PAT) | 81.5 | -10.4 | 30.4 | 30.5 | 57.3* | A return to sustainable profitability after a volatile period. The H1 run-rate is stellar. |
| PAT Margin (%) | 16% | -2% | 5% | 5% | 9% | The bottom-line is booming, up 216% YoY in H1. |
| Gross Margin (%) | 42% | 39% | 48% | 51% | 56% | Indicates a superior product mix and efficient manufacturing. A standout figure. |
H1 FY26 figures annualized for comparison. Source: Company Investor Presentation
The Growth Engine: Why the Future Looks Bright
A strong balance sheet is just the foundation. Wanbury’s true potential lies in its focused growth strategy, primarily driven by its Active Pharmaceutical Ingredients (API) business, which contributes 88% of revenue.
- Global Market Leadership: Wanbury isn’t a small player. It commands an estimated 11% global market share for Metformin (used in diabetes) and a staggering ~30% for Sertraline (an antidepressant). This provides a stable, high-volume revenue base.
- A Pipeline of New Products: The company is not resting on its laurels. It plans to launch a new Anaesthetic molecule in Q4 FY26 and, crucially, commercialize four new molecules every year starting FY27. This systematic product pipeline de-risks growth and provides multiple future revenue streams.
- Formulations Business at Inflection Point: After years of losses, the India-focused formulations business achieved EBITDA break-even in H1 FY26. With a new brand launch (
C-RED) and a planned foray into chronic and speciality therapies, this segment could become a significant profit contributor from FY27 onwards. - Regulatory Moat: With two USFDA-approved plants and successful recent audits from ANVISA (Brazil) and EU-MHRA, Wanbury has the regulatory pedigree to supply to demanding developed markets, ensuring better realizations and sticky customer relationships.
Verdict: To Invest or Not to Invest?
From a Research Analyst’s desk, the picture is compelling but requires a nuanced approach.
The Bull Case: Wanbury presents a rare combination of a successful turnaround story and a clear, executable growth plan. The dramatic improvement in profitability metrics (EBITDA, PAT Margins), the de-risked balance sheet, and the proven global market share in key APIs make a strong fundamental argument. The current P/E ratio of around 15.3, while not dirt cheap, can be justified if the company delivers on its FY26 guidance and FY27 pipeline.
The Risks & Bear Case: The stock has already had a massive run-up. The 52-week high of ₹329.70 also shows it is volatile, and investors who bought near the peak are sitting on losses. The core API business is susceptible to global pricing pressure and raw material cost inflation. Execution of the new product pipeline is key; any delays could disappoint the market.
The Final Call:
For the discerning investor with a medium-to-long-term horizon and an appetite for a high-growth, small-cap story (Market Cap: ~₹800 Cr), Wanbury represents a compelling ‘Buy on Dips’ opportunity. The fundamental turnaround is undeniable, and the growth levers are in place.
The company is no longer just about survival; it’s about scaling new peaks. The management has earned credibility through its execution over the last two years. If they can continue to launch new products and maintain this operational discipline, Wanbury could well graduate from a promising turnaround story to an established mid-tier pharma player, creating significant wealth for investors who board this journey now.
Disclaimer: “BrightStake” is only an Educational Platform and is not registered under any SEBI Regulations. All Information on this page is for Educational and Entertainment purposes only. Our content does not constitute any Trading or Investment advice., We make no representation of the Timeliness, Accuracy, Profitability, or Suitability of any share on this Website, and we cannot be held liable for any Irregularity or Inaccuracy. Our research is conducted solely for educational purposes, so please utilise our knowledge to inform your investment strategy.