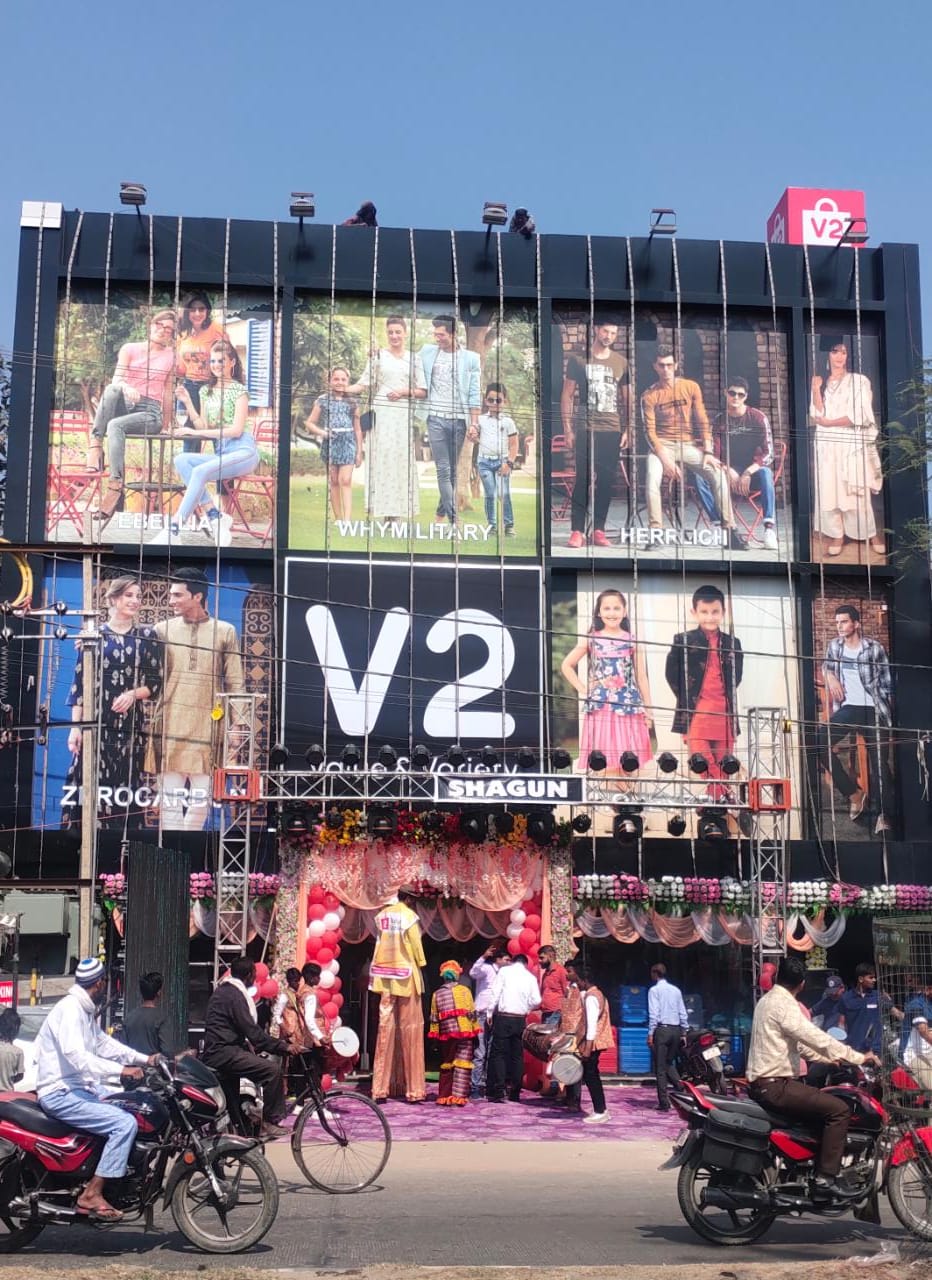
V2 Retail Limited FY25 Financial Results: A Year of Stellar Growth and Strategic Expansion, Revenue Surge 62% YOY And PAT Soars 159%

V2 Retail Limited (NSE: V2RETAIL, BSE: 532867), one of India’s fastest-growing value retail chains, has unveiled its audited financial results for Q4 and FY25, showcasing record-breaking growth across key metrics. With a 62% YoY revenue surge to ₹1,884.5 crores and a 159% leap in net profit to ₹72 crores, the company is riding high on strategic store expansions, robust same-store sales growth (SSG), and operational efficiency. However, recurring audit qualifications related to fixed asset reconciliation cast a shadow on an otherwise stellar report, which investors should closely monitor this stock.

- FY25 financial highlights vs. FY24 and previous quarters.
- Operational strategies driving growth.
- Audit qualifications and their implications.
- Future prospects in India’s booming retail sector.
Section 1: FY25 Financial Performance – Breaking Down the Numbers
1.1 Consolidated Financial Snapshot (FY25 vs. FY24)
| Metric | FY25 (₹ Cr) | FY24 (₹ Cr) | Growth (%) |
|---|---|---|---|
| Revenue from Operations | 1,884.5 | 1,164.7 | +62% |
| EBITDA | 257.8 | 147.8 | +74% |
| EBITDA Margin | 13.7% | 12.7% | +100 bps |
| PAT | 72.0 | 27.8 | +159% |
| EPS (Basic) | ₹20.50 | ₹7.89 | +160% |
Key Drivers:
- Store Network: Expanded from 117 stores in FY24 to 189 stores in FY25 (+74 new stores).
- Same-Store Sales Growth (SSG): 29% despite industry slowdown.
- Volume Growth: 43% YoY, with MRP sales contributing 89% of revenue.
1.2 Quarterly Performance (Q4 FY25 vs. Q4 FY24)
| Metric | Q4 FY25 (₹ Cr) | Q4 FY24 (₹ Cr) | Growth (%) |
|---|---|---|---|
| Revenue | 498.5 | 296.0 | +68% |
| EBITDA | 57.8 | 31.4 | +84% |
| PAT | 6.4 | 3.6 | +79% |
Q4 Highlights:
- Gross Margin dipped slightly to 27.6% (vs. 28.0% in Q4 FY24) due to higher input costs.
- Strong demand in Tier II/III cities offset inflationary pressures.
Section 2: Operational Excellence – How V2 Retail Scaled New Heights
2.1 Store Expansion Strategy
- Geographic Spread: Presence in 20 states and 100+ cities, focusing on underserved rural markets.
- Retail Space: Added ~8.2 lakh sq. ft. in FY25, totaling 20.27 lakh sq. ft.
- Closures: Only 2 stores shut, reflecting efficient location selection.
2.2 Same-Store Sales Growth (SSG) – Industry Leadership
- SSG of 29% in FY25, up from 22% in FY24.
- Drivers: Localized assortments, competitive pricing (avg. price per sq. ft. at ₹1,017), and festive season demand.
2.3 Management Commentary
Mr. Ram Chandra Agarwal, Chairman & MD, emphasized:
*“Our customer-centric approach, curated product mix, and Tier II/III penetration have set new benchmarks. With 29 stores added in Q4 alone, we’re poised for sustained growth.”*
Section 3: Audit Qualifications – A Recurring Concern
3.1 Qualified Opinion from Singhi & Co.
- Issue: Incomplete reconciliation of physical fixed assets (since FY22).
- Impact: Carrying value of Property, Plant & Equipment (PPE) as of March 2025 remains unverified.
- Management’s Stance: Adjustments are “not material,” but auditors emphasize uncertainty.
3.2 Advance to Bennett Coleman & Co. (BCCL)
- Outstanding Advance: ₹14.94 crores (since April 2019) for advertising services.
- Extension: Contract renewed till July 2025; management confident of recovery.
Section 4: FY25 vs. FY24 – A Comparative Analysis
4.1 Revenue Growth Breakdown
| Segment | FY25 Contribution | FY24 Contribution | Change |
|---|---|---|---|
| Apparel | 78% | 75% | +3% |
| Lifestyle | 22% | 25% | -3% |
Insight: Apparel demand surged in rural markets, while lifestyle products faced muted urban sentiment.
4.2 Debt and Liquidity
- Total Borrowings: ₹78.8 Cr (up from ₹45.4 Cr in FY24).
- Cash Reserves: ₹75.5 Cr (vs. ₹62.1 Cr in FY24).
- Debt/EBITDA: 3.1x (improved from 3.7x in FY24).
Section 5: Future Prospects – Can the Momentum Sustain?
5.1 Growth Levers
- Store Pipeline: 50+ stores planned in FY26, targeting ₹2,500 Cr revenue.
- Private Labels: Contribution to rise from 15% to 25% by FY27.
- E-commerce: Pilot launches in 10 cities to tap omnichannel demand.
5.2 Risks
- Audit Overhang: Persistent qualifications may deter investors.
- Rural Demand Volatility: Monsoon dependence and inflationary risks.
Section 6: Industry Context – India’s Retail Boom
- Market Size: $1.1 Trillion by 2027 (IBEF).
- V2’s Positioning: Targets the “neo-middle class” with ₹299–₹1,499 price points.
- Competitors: Reliance Trends, Max Fashion, and Aditya Birla’s Pantaloons.
Conclusion
V2 Retail’s FY25 performance underscores its dominance in India’s value retail segment. While audit concerns linger, aggressive expansion, SSG leadership, and rural focus position it for a bright FY26. Investors should watch for asset reconciliation updates and monsoon-driven demand trends.
DISCLAIMER
______________
“BrightStake” is only an Educational Platform and is not registered under any SEBI Regulations. All Information on this page is for Educational and Entertainment purposes only. Our content does not constitute any Trading or Investment advice. We make no representation of the Timeliness, Accuracy, Profitability, or Suitability of any share on this Website, and we cannot be held liable for any Irregularity or Inaccuracy. Our research is solely for educational purposes, so please build your knowledge with us and use your strategy for investment.
